We have remodelled the Pig prices section adding several options that we hope that are useful.
The most important change is the implementation of a new graphic environment that is much more versatile, that offers more options when seeing the history of prices and making comparisons, whether they are temporary for a same market or between different markets. We have also added an option to see the prices in several units of weight and in different currencies, and this makes the comparison between different markets easier. Also, the information about the currencies exchange rate is also shown in the graphic displays.
Next we will detail the most important novelties in the prices section that you will access at: https://www.pig333.com/markets_and_prices/
Display of the prices in the chosen currency and unit of weight
The option "Unify currency and unit of weight" in the index of the prices section opens a drop-down menu that allows us to choose the currency and the unit of weight with which we wish to see the prices. The markets will be ordered from the lowest to the highest price. Remember that, although the prices can be shown in the same units, the values are not directly comparable, because each market uses a base price with certain features (carcass weight, live weight, lean tissue %,...).

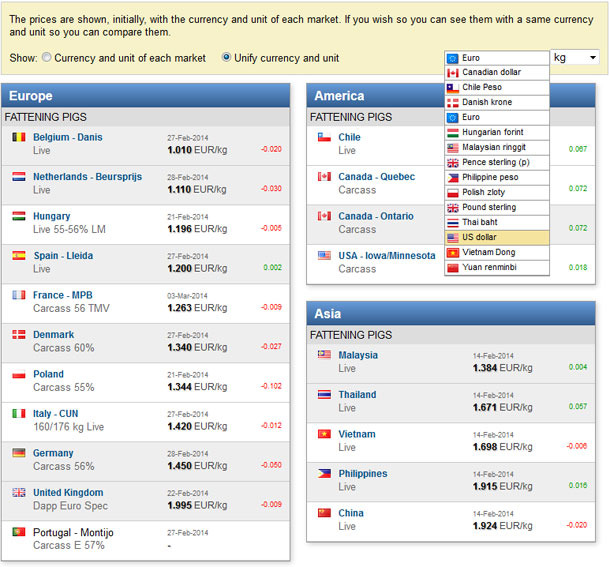
Graph 1. List of the markets with the last registered price, difference with respect to the previous price, in EUR, per kg of carcass or kg of live weight.
Graphical display
When clicking on the name of each country in the section index we will access the graphical display of its price. In the Summary screen we show, initially:
- graph of the evolution during the last year and trend.
- graph of the evolution of the mean price and its variation measured as the standard deviation.
- last prices and difference with respect to the previous price.
If we click on each graph we can enlarge details when obtaining a full screen display.
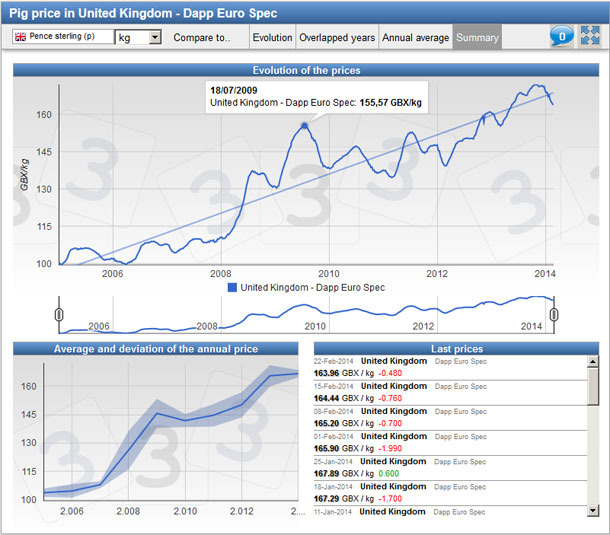
Graph 2. Trend and daily pig prices in the United Kingdom since 2005, the mean price per year since 2005, and the figures for the latest prices.
In this screen, we can choose, through the upper menu, the currency and the unit of weight in which the prices will be displayed, make comparisons with other markets and access different graphical displays.
Compare with... allows us to display up to 4 markets in a same graph. The currency and the unit of weight used for the display is the original one for the market that we have entered, although we can choose others in any moment. The time selector allows us to show different periods of time.
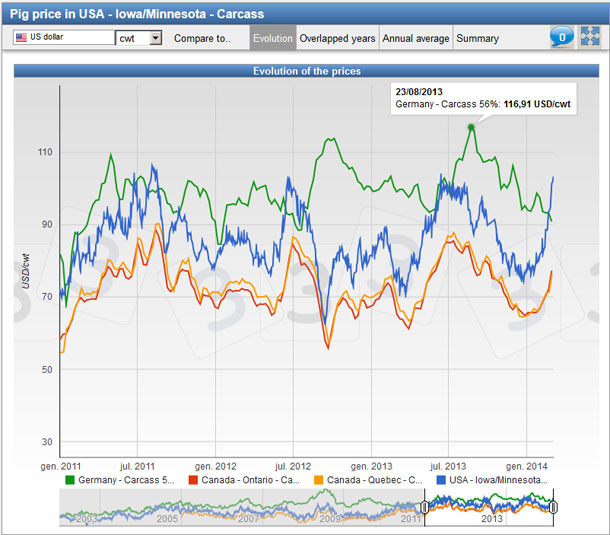
Graph 3. Pig prices in US, Canada and Germany since 2009. All the prices are shown in USD / cwt.
When displaying markets with different currencies, the evolution of the currency exchange rate is shown in the graph.
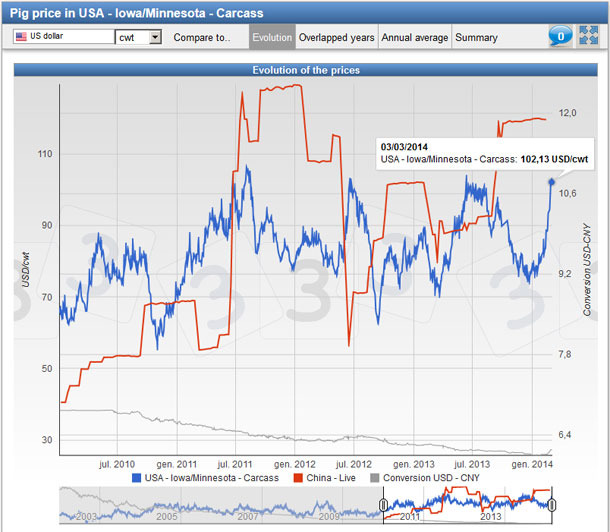
Graph 4. Pig prices in USA and China along with the currency exchange rate since 2010.
Overlapped years changes towards a display of the prices overlapping the years instead of showing them correlatively.
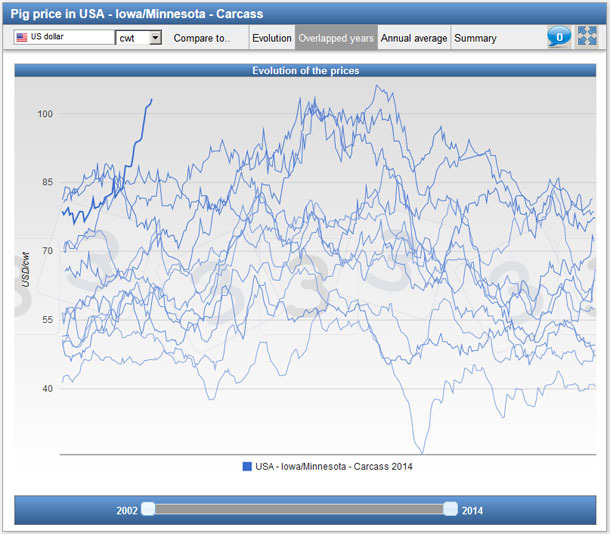
Graph 5. Pig prices in US from 2002 to the beginning of 2014. This view allows the checking of the high current prices for the time of year.
Comments
Write your comments on prices and your opinions will be available to all the users.
The most recent comments are shown on the main page of the section. On the other hand, once we have entered the graphs area we will be able to see the comments and also write comments by clicking on the ![]() icon. Inside each comment we will click on
icon. Inside each comment we will click on ![]() in order to obtain the image about which the comment has been made.
in order to obtain the image about which the comment has been made.
Access
All the information offered in the Prices section is free. Nevertheless, some options are for the exclusive use by the users of 333. In order to be able to access the closed areas enter your user's data (e-mail and password) on the emerging screen that will appear so you can log in.


