In order to really take advantage of all the price information, we have developed some interactive graphics that allow you to visualize prices in various currencies. We use real time currency exchange rates for each market. It is also possible to convert between different units (kg, pounds, cwt or 100 kg). At the same time you can see several correlative years represented in order to see trends or “overlaps”, in order to see the difference between years.

Evolution of Quebec prices from 2007 up to week 24 of 2010, with the data "overlapped" (right) or correlative (left).
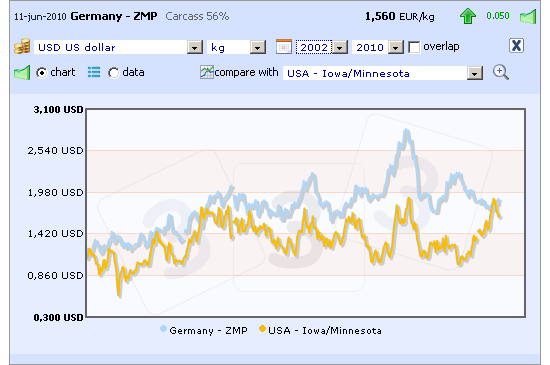
Finally, one of the most anticipated innovations, a new system that also allows the representation of two markets in one graph in order to compare tendencies. Keep in mind that the values are not directly comparable because each market uses a different base (live weight, carcass, lean %...).

Evolution of Germany-ZMP prices (carcass 56%) and USA-Iowa/Minnesota prices (carcass) in American dollars from 2002 up to week 24 of 2010
We hope you find all of these improvements to be useful, and now... lets play!

pig333.com


