Other indicators
In the previous article comparing the United States and Spanish production systems on sow farms, some important differences were already noted, especially in the lactation length which was 4.51 days shorter in the United States (20.65 days vs. 25.16). As for performance in farrowing, there were differences in favor of Spain both in prolificacy, with 0.47 more total born (15.17 vs. 14.70) and in the final result at weaning, with 0.57 more piglets weaned per sow (11.83 vs. 11.26). Next, other production aspects will be analyzed. To do so, we continue to use the PigCHAMP database for both countries and the data for 2019.

First is the replacement rate. The following is a comparison, including a statistical analysis of significance, of the main indicators related to replacement in both countries.
Table 1. Replacement indicators, Spain vs. USA, 2019, Statistical analysis (NPAR1WAY from SAS).
| Spain | United States | P-value | |
|---|---|---|---|
| Sow deaths per year (%) | 9.50 | 12.30 | <.0001 |
| Average age of dead sow (parity) | 2.95 | 3.00 | 0.5903 |
| Sows sold per year (%) | 40.30 | 47.80 | <.0001 |
| Average age of sows sold (parity) | 4.76 | 4.19 | <.0001 |
| Annual replacement (%) | 46.80 | 62.00 | <.0001 |
| 1st matings of gilts (% total matings) | 19.82 | 22.06 | <.0001 |
P-value >0.05 No significant difference
0.05>P-value>0.0001 Significant difference
P-value<0.0001 Very significant difference
First of all, the percentage of on-farm mortality is higher in the United States, in fact, it is 29.5% higher, which represents an important difference. But not only that, the percentage of sows sold is also clearly higher, 18.3%. Moreover, in the case of sales, the average age at sale is lower in the United States, 0.57 less parity. In other words, in the United States, the overall sow culling rate is higher (60.1% vs. 49.8%), and they are also culled earlier, so the average productive life of the sow is shorter.
This logically requires a higher annual replacement (62% vs. 46.8%), with the drawbacks that this entails: higher replacement costs and a higher percentage of gilts on the farm, with the possible health and performance problems that this may entail.
The following is a comparison of performance in farrowing. As mentioned in the first article, there are differences, which are almost always significant, in the main indexes in favor of Spain.
Table 2. Farrowing indicators, Spain vs. USA, 2019, Statistical analysis (NPAR1WAY from SAS).
| Spain | United States | P-value | |
|---|---|---|---|
| Total born/sow (n) | 15.17 | 14.70 | 0.0631 |
| Born alive/litter (n) | 13.67 | 13.20 | 0.0232 |
| Stillborns/sow (% of TB) | 8.11 | 7.66 | 0.0489 |
| Mummies/sow (% of TB) | 1.75 | 2.54 | <.0001 |
| Calculated PWM (% of BA) | 13.16 | 14.55 | <.0001 |
| Average age of dead piglet (days) | 5.85 | 3.70 | 0.0048 |
| Piglets weaned/sow (n) | 11.83 | 11.26 | <.0001 |
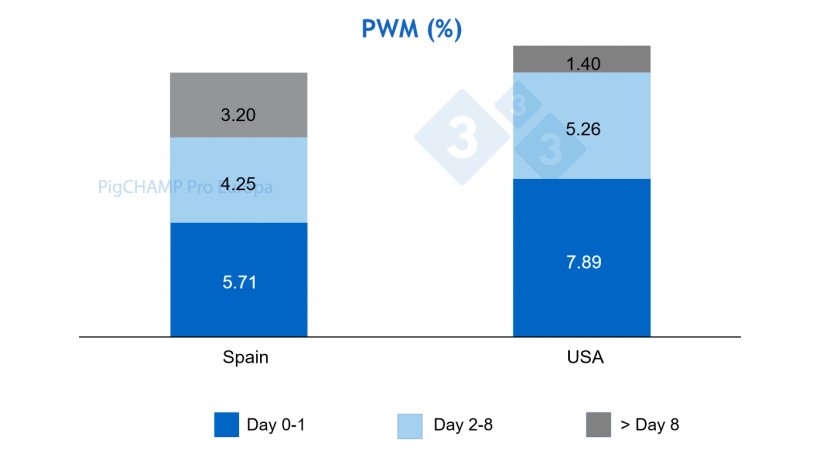
If we focus on pre-weaning mortality, one of the farrowing indicators most directly influenced by management, we see that it is lower in Spain, despite the fact that the average number of piglets born alive is higher. As for the average at death, it is higher in Spain (5.85 days vs. 3.70). The distribution of mortality by age range is compared below.

Figure 1. Distribution of preweaning mortality by age at death. Spain vs. USA, 2019.
The fundamental difference in favor of Spain is found in the deaths at less than 9 days of age. Therefore, the conclusion is that in Spain we achieved lower pre-weaning mortality, despite having more piglets born alive, fundamentally due to better management in the first days of lactation, a key stage in the life of the piglet.
Finally, there is one parameter that is important to take into account in farrowing, which is weaning weight. As mentioned above, the average lactation length in the USA is clearly shorter, so logically the average weaning weight is also less. By estimating weight according to age (via regression of weaning weight data from the PigCHAMP Pro Europa database), from the piglets weaned per sow per year we can calculate the kg weaned per sow per year. The following table compares these parameters in both countries.
Table 3. Performance at weaning, Spain vs. USA, 2019.
| Spain | United States | Difference (%) | |
|---|---|---|---|
| Piglets weaned/sow/year (n) | 26.93 | 26.08 | +3.3 |
| Estimated weight at weaning (kg) | 7.1 (25.16 days) |
6.0 (20.65 days) |
+18.3 |
| Weight weaned/sow/year (kg) | 186.73 | 156.48 | +19.3 |
The difference, barely appreciable if we compare the number of piglets weaned per sow per year, becomes almost 20% more weaning weight per sow per year in Spain. This is an advantage not only for the value itself, but also for what a higher weaning weight means for the performance in the nursery and finishing: improvements in growth rate and feed conversion ratio, lower mortality, fewer days to slaughter.
To conclude all that has been analyzed in these two articles, we can affirm that production on sow farms in Spain has known not only how to adapt, but also how to take advantage of the existing conditioning factors (age at weaning, welfare), achieving higher efficiencies in aspects such as kg weaned per sow per year, or sow retention rate, than the American production, which is more based a high pace of production.


