Porcine circovirus type 2 (PCV2) has been identified as the responsible agent of Post-weaning multi-systemic wasting syndrome (PMWS) - one of the most important and damaging disease in pigs worldwide. Interestingly the presence of the virus itself is not enough to trigger clinical signs, but a complex interaction between the virus, environment, management practices and other pathogens is needed. As a consequence, severity of the disease is highly variable and the diagnosis is difficult. The complexity becomes even greater with the existence of PCV2 subclinical infections (PCV2SI), which refers to pigs infected by the virus and not showing clinical signs, with the exception of reduced growth. These pigs can also be more susceptible to other pathogens and corresponding diseases.
So, how can we understand what the economic impact of PMWS and PCV2 subclinical infections on a farm is and what the most cost-effective control measure could be? These, indeed, are very difficult questions that we addressed in our study:

In first instance, the severity of the disease needs to be determined on a farm. Obviously, the economic impact of the disease, and the cost-effectiveness of a control measure, will be different depending on how severely a farm is affected. On a survey of 147 pig farms in the United Kingdom a correlation between three parameters was identified: Post-weaning mortality, PMWS morbidity (quantity of PMWS animals observed) and percentage of PCV2 infected pigs on a farm. A “PMWS severity score” ranging from 0 to 10 was then created by combining these three parameters, which indicate if the farm is slightly (<4.5), moderately or highly (>6) affected by the disease.
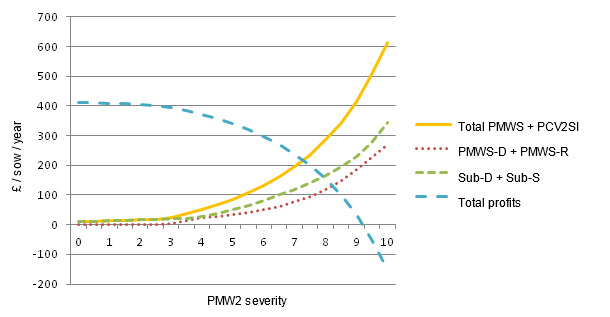
In second instance, to calculate the cost of PMWS and PCV2SI it is important to identify what the extra costs and extra benefits incurred by these diseases are. Different types of sick pigs were defined: Pigs with PMWS clinical signs that die (PMWS-D), pigs with PMWS clinical signs that recover (PMWS-R), infected pigs with only slow growth (named here as subclinically infected pig that survives – Sub-S) and pigs that die due to other infections or syndromes, which were facilitated by PCV2 subclinical infection (Sub-D). Using UK benchmarking data and disease parameters obtained from an experimental study on PMWS, it was calculated that the average cost of each pig was: £84 per PMWS-D, £25 per PMWS-R, £83 per Sub-D and £8 per Sub-S. By knowing how many of these pigs are present on a farm at different PMWS severity scores, it was estimated that the total cost of PMWS and PCV2SI was £21/sow/year, £108/sow/year and £245/sow/year for an average slightly, moderately and highly affected farm, respectively. Furthermore, it was observed that, at farm level, the aggregated cost of subclinical pigs was higher than the aggregated cost of PMWS pigs (Figure 1).

Figure 1. Cost of PMWS and PCV2SI for different PMWS severity levels (Alarcon et al, 2013)
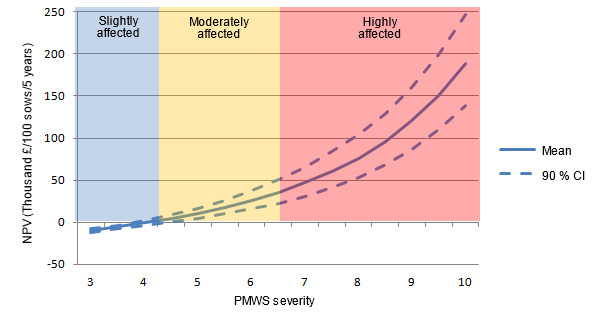
Once the cost of the diseases is estimated, the benefit of applying different control strategies can be calculated. Control measures aimed at removing risk factors on farm, e.g. poor biosecurity measures, high stocking density, poor diets and co-infection. Vaccination also has been demonstrated being an effective measure to control PMWS. The Royal Veterinary College has developed a model that simulates the production of pigs in a farm with a given PMWS severity score. The model was used to assess what would be the extra cost and extra benefits of the following control measures: 1) reducing stocking density, 2) improving biosecurity measures, 3) improving diets, 4) total depopulation and repopulation, 5) PCV2 vaccination and 6) any combination of these. The model results showed that for moderately affected farms, PCV2 vaccination only was the most cost-effective strategy (a farmer could save on average £14,739/100 sows/5 years). However, for farms highly affected by these diseases, the most cost-effective strategy was either vaccination alone or vaccination with good bio-security measures (save £57,648/100 sows/5 years). PCV2 vaccination alone was only cost-effective for farms with a PMWS severity score higher than 4 (Figure 2). Farms with a severity score less than 4 might be affected by the diseases, but at a level that is not cost-effective to vaccinate.

Figure 2. Net present value (NPV) of PCV2 vaccination alone for different PMWS severity scores (Alarcon et al., 2013).
The economic model described here is available online. It was create to provide a decision support tool for farmers and veterinarians, who can enter their own data to calculate the severity of PMWS on their farm, the cost of disease and what could be the most cost-effective control measure. Results should be discussed with the veterinarians.


