Whether they are internal or external. replacement gilts are one of the most important costs in a sow farm. A replacement rate of 40 to 50% is currently considered appropriate to keep a correct parity distribution structure. This article compares two farms with clear differences, both in replacement rates and parity distribution structures (average age and distribution per cycle).
To begin with, it shows the evolution of their replacement rate and average age over the last 3 years.

Farm A
| 2014 | 2015 | 2016 | Mean | |
| No. of productive sows | 3040 | 3009 | 3198 | 3082 |
| Replacement rate % | 68.4 | 60.0 | 64.7 | 64.4 |
| Average age (cycle) | 2.0 | 2.3 | 2.7 | 2.33 |
Farm B
| 2014 | 2015 | 2016 | Mean | |
| No. of productive sows | 853 | 866 | 880 | 866 |
| Replacement rate % | 43.0 | 46.0 | 42.7 | 43.9 |
| Average age (cycle) | 4.0 | 3.8 | 3.5 | 3.76 |
Farm B, despite having a replacement rate more than 20% lower than farm A, not only maintains, but even reduces its average age, whereas farm A, even though it has a very intensive replacement rate, increases its average age. What is the reason for this difference?
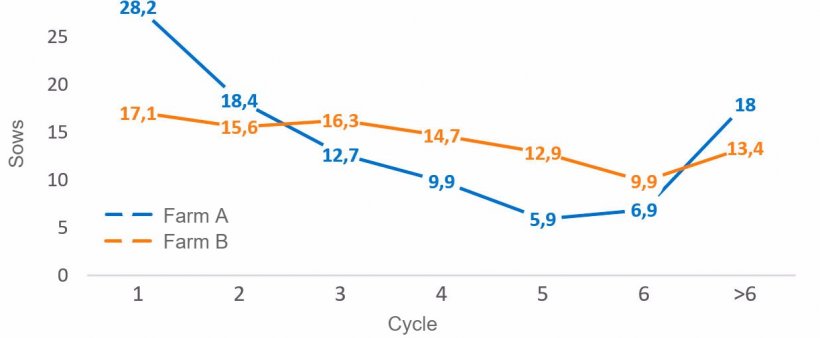
The replacement rate obviously depends on the number of sows culled in both farms: farms need to introduce as many gilts as sows are being culled to maintain the census. Therefore, it is clear that farm A is culling a higher percentage of sows. The next question would be: Why has farm A a higher culling rate? The next figure, showing the percentage of sows culled per cycle in 2016, gives a clear clue.

Farm A is culling many more sows in their earlier cycles. On the contrary, farm B keeps many more sows until their older cycles, which allows the farm to do a very significant part of its culling after the sows’ 6th parity. In fact, if we compare the average age of the sows that die to the age of the sold ones, we find the following
| Average age Deaths (cycle) |
Average age sales (cycle) |
|
| Farm A | 3.4 | 3.6 |
| Farrn B | 3.6 | 7.1 |
Whilst the age at which sows die is very similar, the age at which they are sold (sows that we decide to cull) is clearly higher in farm B.
The first consequence of this high removal of young sows, the need to increase the number of replacement gilts, has already been discussed. When comparing the parity distribution of both farms, a second consequence becomes apparent.

Graph 2. Parity distribution per cycle by 31st December 2016
Farm A, despite the high replacement rate, does not have many sows in those cycles that would be more productive (3rd to 5th), and on top of it, it is forced to keep many old sows in the farm to avoid reducing the total census. Therefore, its parity distribution is similar to a U shape, one of the less productive there are.
Based on the data shown, the conclusion is clear: minimizing sow losses in the initial cycles has three positive effects for the economic efficiency of the farm
- Reduction of the percentage of replacements needed.
- Increase of the length of the average productive life of the sow, obtaining a better return on investment for every new female.
- A more productive parity distribution.
Obviously, this must not be achieved by keeping the young sows “at all costs”; it is done by maintaining the limits for sow culling (for example, a sow that repeats more than twice, or an abortion with discharge must still be culled), but reducing the problems that lead to culling (reproductive failure, lameness).

The data in this article can be linked to the one from a previous paper published in this section ("At long last, we can now predict a sow's performance from her first farrowing"). That article showed that amongst other benefits, the sows with high prolificacy at first farrowing have a lower culling rate in the initial cycles. The results of both articles support the conclusion that obtaining a high performance from our sows during the first cycle has many productive advantages, and therefore economic ones, for our farms.


