Given the high prevalence of the infection due to the PCV2 and its presence in healthy and sick animals, the serological tests against this pathogen have been questioned as a diagnostic test. It is known that the circovirus diagnosis must be based on Sorden’s criteria. Nevertheless, these tests have an interest that is based on the kind of test, its availability and the circumstances or the conditions in which we expect to use it, as well as on their aim.
Because of the fact that the indirect immunofluorescence (IFA) test is not used in our environment and that the immmunoperoxidase monolayer (IPMA) assay is practically restricted to the scientific field due to its nuisance and its limited availability, we shall not discuss them in this brief revision. We will only state that, for some experts, the latter assay would be the reference test in which the immunoenzimatic or the ELISA assays are assessed.

ELISA assays
Amongst the ELISA tests available we can find two main groups:
- The blocking assays, whose goal is the determination of the IgM and the IgG immunoglobulins.
- The indirect tests, that are destined to detect total antibodies.
Blocking ELISAs
At present we have a commercial kit available that is very useful in the following conditions:
- Detection of the infection period and of the viral circulation, providing that the animals have not been vaccinated or that they have been vaccinated with a vaccine that elicits a low response or a response that is not detectable with this assay.
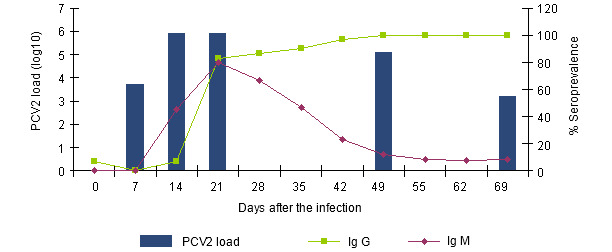
- The relationship between the level (0% of animals with a positive response) of IgM and IgG is indicative of the moment in which the infection or the viral circulation has started (see Figure 1).
Figure 1.- Evolution of the IgGs and IgMs response measured with a blocking ELISA (INGENASA) and of the PCV2 viremia after an experimental exposure (Segalés et al. 2005)

The IgMs are detected since the 7th-14th day after the infection, a week before the IgGs. Three weeks after the infection, the seroprevalence is similar. Whilst the IgGs remain, the IgMs disappear gradually. The relative distance between them signals us the period of time passed from the moment of the infection.
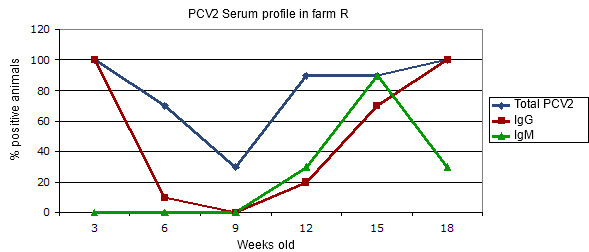
- Follow-up of the viral circulation in the batches, in their clinical as well as in their subclinical form (Figure 2).
Figure 2.- Transversal serum profile in a farm affected by a clinical circovirus infection in the absence of vaccination.

Farm with PMWS problems since the 10th week of age. The total antibodies level gives us an idea of the maternal immunity in the first place and of the post infection serum conversion afterwards. The different age groups may have had slightly different infection moments. In order to interpret this graph, it is convenient to see Figure 1.
Obviously, we have to be cautious when interpreting the results, because, as we have said, in this process, infection is not equal to illness, especially if the animals have been vaccinated previously. On the other hand, due to the high prevalence of the PCV2, these tests have a scarce interest in adult sows, and its use is normally restricted to the piglets and the growing pigs.
Indirect ELISAs
With respect to the total antibodies assays, we have many tests commercially available or offered by the laboratories that carry out the assays. Their utility can be based on (Figure 2):
- The follow-up of the maternal immunity and the eventual study of the interference caused by it.
- As a complement of the IgG/IgM test in the serum profiles.
- Evaluation of the immune state of the sows and the piglets (colostrum intake).
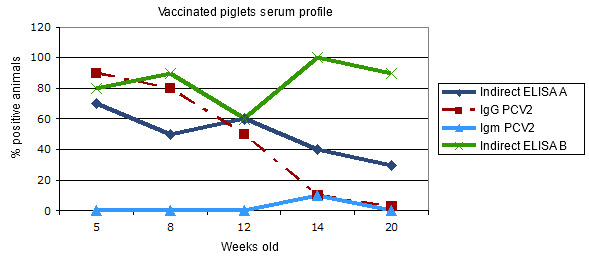
- Eventually, the evaluation of the quality of the vaccine administering1, according to the kind of vaccine used and to the diagnostic kit used (Figure 3).
Figure 3.- Transversal serum profile in piglets vaccinated against PCV2 when weaned: comparative response in two indirect ELISA assays for total antibodies.

The IgG response indicates an evolution of the maternal antibodies and/or a short duration seroconversion after the vaccination. The IgM remains at basal levels due to the absence of infection. The indirect assays behave in a different way: whilst test A corresponds to the maternal immunity in the first place and to a weak response with respect to the vaccine, test B would be more sensitive, showing a better response to the vaccination. Obviously, they measure different antibodies.
With respect to these tests, it is convenient to clarify that they are not related to the degree of protection in the vaccinated animals, because there are vaccines that do not give place to a response against some of these tests or the response is irregular, without this being a sign of a lack of protection.
On the other hand, it is normal to find different results with different commercial tests (Aleff et al. 2007). So it is possible, for example, that whilst an assay shows weak or inconsistent results, another one allows us to measure the vaccinal response perfectly (Figure 3). So, not being aware of this fact can give place to erroneous interpretations. On the contrary, a good knowledge of the serologic assay, summed to its use in a correct situation, can be of great help in order to know the epidemiological or the vaccinal situation and to apply useful measures. In any case, when interpreting serological results, a good sampling scheme is recommendable, as well as the knowledge of the circumstances of the sampled animals and to consult an experimented person about the use and the interpretation of each assay used.
Finally, it must be highlighted that, although we frequently talk about “titres”, the majority of these tests are “qualitative”, and this means that values that exceed a certain threshold are considered as positive and those that are under it are considered as negative, so trying to make a quantitative interpretation out of them can be frustrating or at least confusing. As an alternative, some suppliers propose the execution of the analysis of the same sample in various wells, reaching a “semiquantitative” result by means of an adequate mathematic calculation. Another people produce a ratio or index value, sometimes called S/P ratio that is calculated as a “relationship between the readout value of the sample and the positive control once we have deducted the negative control value from both”. Other times, the readout value of the well is compared to a default scale of positive control values and, sometimes, a mathematical formula is applied to the readout value of the optical density in order to assign a titre to it that was normally produced carrying out a parallel analysis with a reference test (Segalés et al. 2011). So, we have to be cautious when establishing conclusions based on quantitative results, although depending on the obtaining method and on the aim of the evaluation, they could sometimes be helpful.
1 A specific ELISA test has been developed in order to check the quality of the vaccination with respect to one of the commercial vaccines based on the antibodies response against the baculovirus.


