STOCKS/INVENTORY
The country’s swine inventory as of January 1, 2010 was estimated at 13.4 million head. This was 1.46% lower compared to 2009 inventory of 13.6 million head. The beginning stocks in backyard farms decreased by 0.63% and those in commercial farms dropped by 3.46% against the 2009 levels. About 71% of the swine population were raised in backyard farms while 29% were in commercial farms.
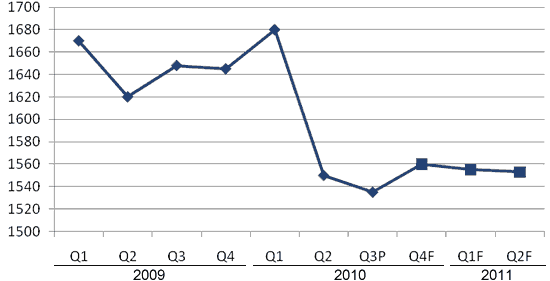
In the same period, the sow’s inventory was estimated at 1.67 million head. It was 0.47% higher than the 2009 level and accounted for 12.5% of the total swine inventory. Backyard sow level stood at 1.17 million and commercial farms had 0.5 million head.
Sow inventory as of July 1, 2010 posted a decrease of 7.36% or 121,150 head lower against the 2009 level.
As of July 1, 2010, the inventory of fatteners/finishers was recorded at 3,446,343 head or 5.75% lower than the level in the same period in 2009.
The inventory of growers as of the beginning of the 3rd quarter of 2010 was 3,830,412 head. This was 0.31% lower than the level in 2009.
Figure 1. Fatteners/Finishers and Growers Inventory, Philippines, 2009 – 2011 (in ‘000 head)
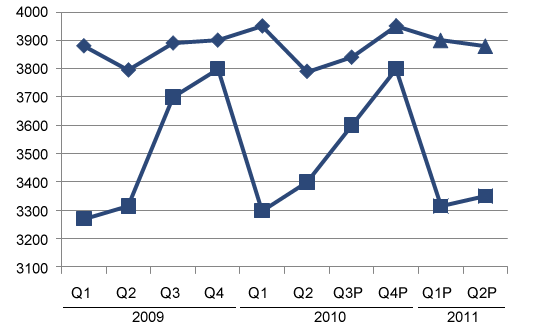
Figure 2. Sow Level Inventory, Philippines, 2009 – 2011 (in ‘000 head)

FORECASTS
In the 4th quarter of 2010, the fatteners/finishers inventory may decrease by 0.40% from the Q4 2009 level. Increases of 2.64% and 0.94% are expected in the 1st and 2nd quarters of 2011, respectively.
Grower’s inventory in Q4 2010 may go up by 1.59% from the Q4 2009 level. In the 1st quarter of 2011, inventory of growers is foreseen to post an increase of 1.08%. In the 2nd quarter of 2011, an increase of 3.96% is expected against the level in 2010.
The sow inventory in the 4th quarter of 2010 may be 5.08% lower than the level in Q4 2009. A decrease of 6.87% in sow inventory is expected in the 1st quarter of 2011 while in the 2nd quarter, the sow inventory is foreseen to have almost the same level from the inventory in the same period in 2010.
PORK SUPPLY
Supply of pork was not enough to meet the demand in the 2nd quarter of 2010. In the 2nd quarter of 2010, pork supply was 343,775 metric tons or an increased by 6.70% from the 2009 level. However, in the 2nd half of 2010, supply of pork posted a surplus with a 7.83% higher than the level in 2009. A surplus of about 6,151 metric tons was expected in the 4th quarter of 2010 which is 6.9% higher than Q4 2009.
A 5.76% growth in pork supply is expected in the 1st half of 2011 from the recorded supply of 681,113 metric tons in the 1st half of 2010. Supply increases of 7.25% and 4.30% are expected in the 1st and 2nd quarters of 2011, respectively.
Despite the increases in the pork supply, deficit scenarios are expected in the 1st and 2nd quarters of 2011.
Figure 3. Quarterly Pork Supply, Philippines, 2008 – 2011F (in ‘000 metric tons)
Source: BAS, BAI-NVQS
PORK DEMAND
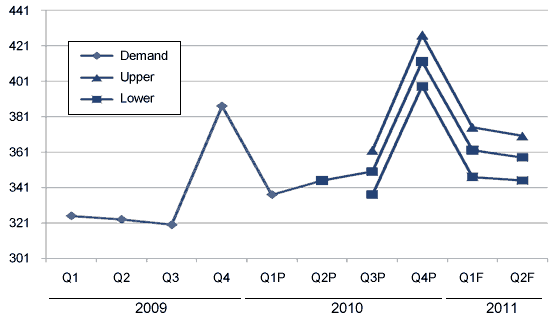
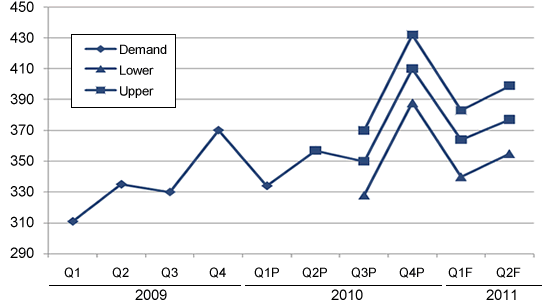
Demand for pork in the 2nd quarter of 2010 increased by 4.26% against the level in the same period in 2009. Demand in the 3rd quarter of 2010 increased by 4.70% while that in the 4th quarter may go up by 10.16%. Hence, a 7.58% growth in pork demand is expected in the 2nd half of 2010.
In the 1st half of 2011, demand will likely be 7.55% higher than the demand for the 1st half of 2010. An 8.33% growth in demand is expected in the 1st quarter while 6.81% is foreseen in the 2nd quarter of 2011 against the levels in 2010.
Figure 4. Quarterly Pork Demand, Philippines, 2009 – 2011F (in ‘000 metric tons)
Source: BAS, BAI, NSO and NSCB
HOG PRODUCTION
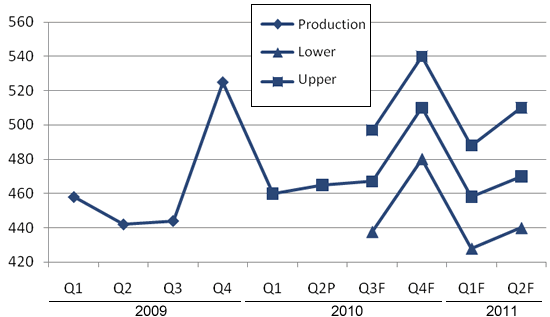
In the 2nd quarter of 2010, hog production was estimated at 459,400 metric tons or 2.88% higher than the 2009 level. In the 3rd quarter of 2010, production may increase by 2.74% from the previous year. However, a decrease of 2.69% is expected in the 4th quarter of 2010 compared to the 2009 level. Hence, hog production in the 2nd half of 2010 is expected to have no change from the production in the same period of 2009.
In the 1st half of 2011, production may have a 0.35% increase compared to the level in the 1st half of 2010. Production in the 1st quarter of 2011 may be 0.65% below the Q1 2010 level. In the 2nd quarter of 2011, production is expected to go up by 1.34% from the level in the same period in 2010.
Figure 5. Quarterly Hog Production, Philippines, 2009-2011F (in ‘000 metric tons)
PRICES
In 2010, the annual average farmgate price of live hogs was recorded at Php 93.15 per kilogram.
At retail markets, the 2010 annual average price of pork was Php 163.88 per kilogram.
Figure 6. Monthly Average Farmgate and Retail Prices of Hog/Pork, Philippines, 2009 – 2010 (Peso per kilogram)
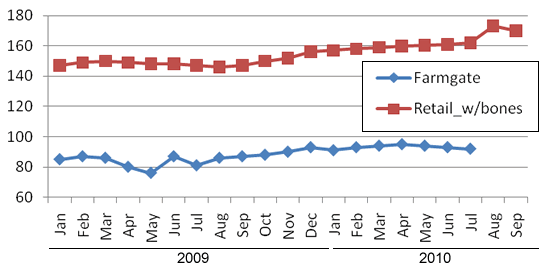
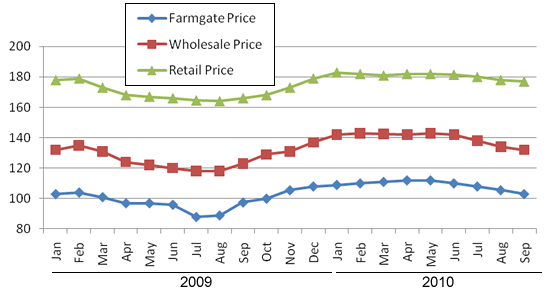
Figure 7. Monthly Average Farm gate 1/ , Wholesale 2/ and Retail Prices of Hog/Pork at Different Public Markets in Metro Manila, 2009 – 2010 (Peso per kilogram)
SWINE HEALTH
The major disease concerns in 2010 were Porcine Circovirus (PCV2), Porcine Reproductive and Respiratory Syndrome (PRRS), Porcine Epidemic Diarrhea (PED), Pseudorabies (PRV), Classical Swine Fever or Hog Cholera and Swine Influenza (SI).
Biosecurity measures coupled with active and passive surveillance of affected areas were initiated. This was followed by vaccination, animal movement management, and continuous education of farmers about the disease.
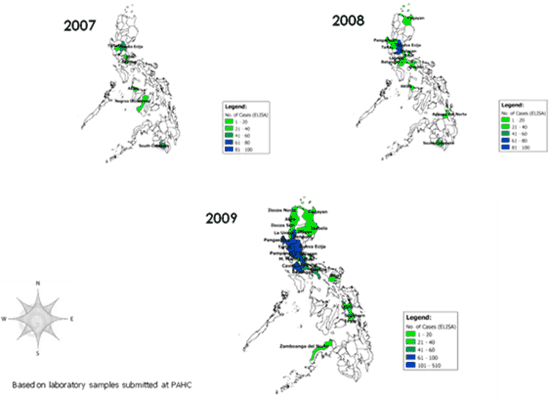
For PRRS, the government subsidized vaccinations for backyard farms using modified live virus vaccine. Vaccination targeted the age group of sows, gilts, boars and piglets at 21 days old. The program started in August 2008 to reduce disease outbreaks.
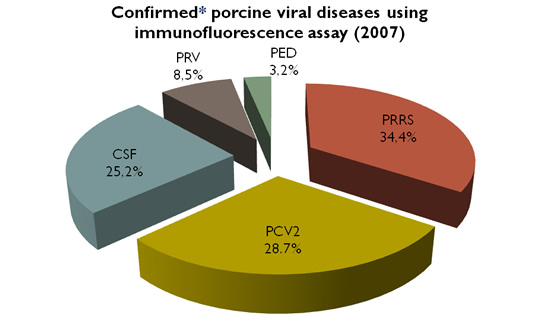
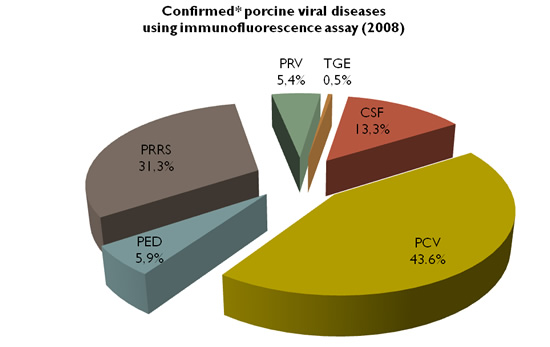
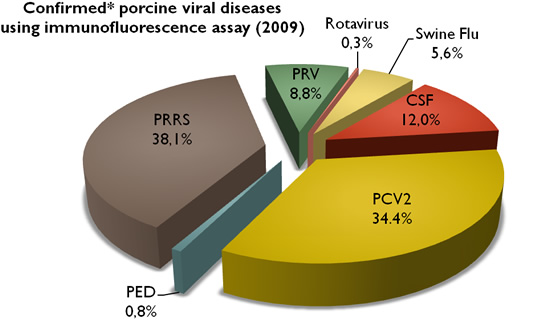
Source: Philippine Animal Health Center
Geographic distribution of PRRS (ELISA)
