Brazil is the main worldwide exporter of meat
Brazil is the fourth biggest producer of meat in the world and the biggest exporter. The country has maintained this position since 2007 and this reflects the effort of Brazilian producers and the government in the areas of genetics, nutrition, management and attention to worldwide quality standards. As can be seen in Table 5, Brazil is the biggest exporter of poultry and beef, and the fourth biggest exporter of pork.
Table 5 - Biggest worldwide exporters of meat, 2008 (millions tonnes).
|
Beef
|
Pig
|
Poultry
|
Total
|
|
| Brazil |
2.150
|
0.529
|
3.850
|
6.529
|
| USA |
0.836
|
2.300
|
3.200
|
6.236
|
| EU-27 |
0.100
|
1.300
|
0.773
|
2.173
|
| Canada |
0.406
|
0.914
|
0.180
|
1.500
|
| Australia |
1.295
|
0.043
|
0.033
|
1.371
|
Brazil: pig exports
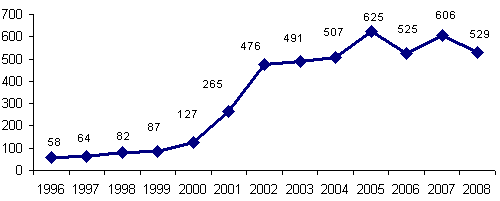
Brazilian pig exports have shown an important increase in recent years due to the excellent competitiveness of our product on the foreign market. As can be seen in Graph 5, in 1997 Brazil exported 64,000 tonnes and was only the world's eighth biggest exporter. In 2008, with 529,000 tonnes exported, Brazil confirmed the position obtained in 2002 as the world's fourth biggest exporter, behind only the United Status, the European Union and Canada.
Graph 5 - Evolution of Brazilian pig exports (thousands of tonnes).

Exports represent 17.3% of the total of all pig meat produced in our country. In 2008, Russia was one of the main importers of Brazilian pig meat, receiving 42% of the total (Table 6). This dependency on Russian purchases was greater in the past, when the the figure reached 75% of exports. The consistant reduction of this depency is the result of a serious effort from the government and ABIPECS in the search for new markets.
Table 6 - Brazilian pig exports according to country (volume and sales), 2008.
| Country |
Quantity tonnes
|
%
|
US$, thousands
|
%
|
| Russia |
225,792
|
42.65
|
741,524
|
50.13
|
| Hong Kong |
108,176
|
20.43
|
236,061
|
15.96
|
| Ukraine |
49,363
|
9.32
|
135,847
|
9.18
|
| Argentina |
25,003
|
4.72
|
68,172
|
4.61
|
| Singapure |
22,008
|
4.16
|
63,945
|
4.32
|
| Angola |
21,834
|
4.12
|
49,185
|
3.33
|
| Moldavia |
16,855
|
3.18
|
42,305
|
2.86
|
| Uruguay |
10,458
|
1.98
|
26,173
|
1.77
|
| Others |
37,515
|
9.43
|
86,816
|
7.85
|
| Total |
529,418
|
100.00
|
1,479,242
|
100.00
|
Exports: the main cause of the increase in pig production in Brazil
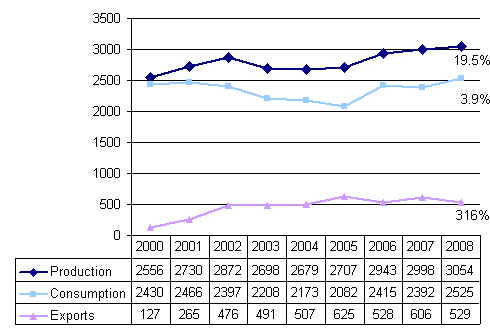
During the period 2000 to 2008, the Brazilian pig production increased by 19.5% but national consumption only increased by 3.9%. The main cause of the increase in production was the exportation to more than 70 countries. Total exports increased by 316%, an average of 39.5% per year. The high quality of the product and low cost were the main factors is this aggressive increase.
Graph 6 - Evolution of Brazilian pig production, consumption and exports (thousands of tonnes)

Brazilian pig production costs, December 2008
Table 7 shows the cost of pig production. In general, the cost of feeding represents 70% of total production costs, and the so-called "other costs" (labour, energy, taxes, medication, etc) made up the remaining 30%. The total cost of feeding in December 2008 came to 62.44 euros per pig and the other costs came to 18.76 euros. The total cost of production (sum of feeding and other costs) was 81.20 euros for each pig of 105 kg. liveweight. If we divide the total cost by kg liveweight, we see that the cost per kg. liveweight was 0.77 euros.
Table 7 - Brazilian pig production costs, December 2008.
| Feeding |
Consumption (kg)
|
Feeding costs (Euros/kg)
|
Total costs (Euros)
|
| Prestarter 1 |
1.4
|
0.87
|
1.22
|
| Prestarter 2 |
3.0
|
0.63
|
1.89
|
| Starter 1 |
7.0
|
0.44
|
3.08
|
| Starter 2 |
21.0
|
0.25
|
5.25
|
| Growth |
90.0
|
0.20
|
18.00
|
| Finished |
110.0
|
0.18
|
19.80
|
| Sow and pig |
60.0
|
0.22
|
13.20
|
| Total feeding costs (70%) |
-
|
-
|
62.44
|
| Other costs (30%) |
-
|
-
|
18.76
|
| Total cost * |
-
|
-
|
81.20
|
| (*)Total cost per live pig of 105 kg (Cost/kg liveweight = Euros 0.77). | |||
Main Brazilian producers of pigs, 2004 - 2007
Table 8 shows the names of the main Brazilian pig producers and their evolution in head production in the period 2004 - 2007. All of them are well integrated in the south of the country and some of them have new projects in the west-central region.
Table 8 - Main Brazilian pig producers and their growth from 2004 to 2007 (in millions of head produced).
|
2004
|
2007
|
%
|
|
| Sadia |
3.523
|
4.556
|
29.3
|
| Perdigão |
3.183
|
3.649
|
14.6
|
| Aurora |
2.255
|
3.036
|
34.6
|
| Alibem |
0.558
|
1.541
|
176.1
|
| Seara |
1.501
|
1.482
|
- 1.2
|
| Riosulense |
1.100
|
1.131
|
2.8
|
| Frangosul |
0.662
|
0.820
|
23.8
|
| Frimesa |
0.341
|
0.640
|
87.6
|
What can we expect from Brazil in the near future?
The prospects for growth in Brazilian meat production is summarized in Table 9. According to the Brazilian Ministry for Agriculture, swine production will increase from the current level of 3.054 million tonnes to 4.3 million tonnes in 2018, an increase of 38.7%. Poultry meat will increase by 56.7% and beef will increase by 49%.
According to figures from OCDE/FAO, in the same period the world production of swine will increase by 21.8%, poultry by 21.5% and beef by 18.6%.
Table 9 - Growth prospects of world and Brazilian meat production, 2008 to 2018 (millions of tonnes)
|
2008
|
2018
|
Brazil (%)
|
World (%)
|
|
| Poultry |
11.1
|
17.4
|
56.7
|
21.5
|
| Beef |
10.4
|
15.5
|
49.0
|
18.6
|
| Pig |
3.05
|
4.3
|
38.7
|
21.8
|
The prospects of Brazilian exports are summarized in Table 10. According to the Brazilian Ministry of Agriculture, pig exports will increase from the current level of 529,000 tonnes to 1.2 million tonnes in 2018, an increase of 126%. Poultry exports will increase by 71.4% and beef by 113.9%.
Table 10 - Growth prospects of Brazilian meat exports, 2008 to 2018 (millions of tonnes)
|
2000
|
2008
|
2018
|
2018/2008 (%)
|
|
| Poultry |
0.916
|
3.850
|
6.600
|
+126.0
|
| Beef |
0.630
|
2.150
|
4.600
|
+113.9
|
| Pig |
0.128
|
0.529
|
1.200
|
+71.4
|
| Total |
1.674
|
6.529
|
12.400
|
+89.9
|


