Quality control consists of carrying out a protocol that includes physical, chemical, and microbiological analyses to ensure feed quality and to prevent, detect, and manage risks.
Sampling
The first step in quality control is sampling, which is essential to the reliability of the results of the analyses and subsequent decision-making about the use of ingredients and/or feedstuffs. The basic principle is to be able to represent the total material in a small portion.

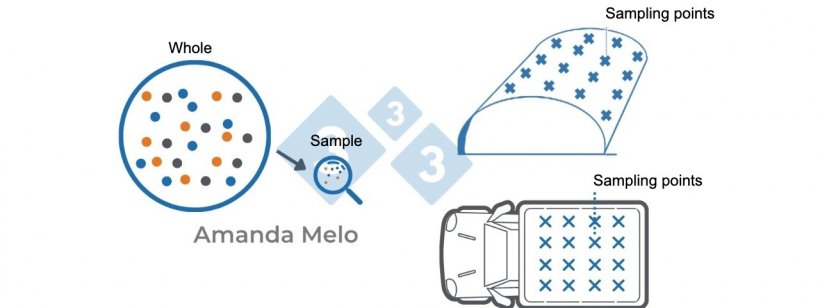
Figure 1 shows a representative sampling in a bulk truck and in silo bags.

The sample must be representative, it must be taken using the appropriate methodology.
For the bulk truck sampling approach, use a probe suitable for the raw material and insert it to the bottom so that all the levels of the bulk are sampled. For silo bag sampling, use a probe suitable for the raw material and insert it at an angle of approximately 30° to the bottom so that all parts of the mass are sampled.
Physical analysis
This consists of macroscopic and organoleptic analyses. They are the first control filter, where parameters such as grain quality (damaged, broken, heat damaged, sprouted, etc.), presence of impurities and live insects, color, odor, and texture are evaluated. In spite of their simplicity, their low cost, and the fact that they do not require expensive equipment, they can prevent significant economic losses to the producer.
Table 1. Parameters that comply with the quality standard for corn marketing on the Rosario Stock Exchange, Argentina.
| Dent corn (Red-Yellow-White) | |||
|---|---|---|---|
| Quality parameter* | Grade 1 | Grade 2 | Grade 3 |
| Moisture (%) | 14.50 | 14.50 | 14.50 |
| Hectoliter weight (kg/hl) | 75.00 | 72.00 | 69.00 |
| Insect damaged grains (%) | 3.00 | 3.00 | 3.00 |
| Damaged grains (%) | 3.00 | 5.00 | 8.00 |
| Broken grrains1 (%) | 2.00 | 3.00 | 5.00 |
| Foreign materials (%) | 1.00 | 1.50 | 2.00 |
| Datura ferox seeds (units/100g) | 2.00 | 2.00 | 2.00 |
*Maximum tolerances for each grade. 1Those grain fragments that pass through a sieve with circular holes 4.76 mm in diameter (+/- 0.013 mm) excluding damaged grains. Source: Rosario Stock Exchange. Standard XII - Resolution SAGyP 1075/94.
Another important physical parameter is particle size, which can either positively or negatively affect the performance and health of the pigs, as well as the energy expenditure of the plant and the proper mixing of the feed. This analysis is carried out by means of a set of sieves on a vibrator, where we obtain the GMD (geometric mean diameter) values and the standard deviation.
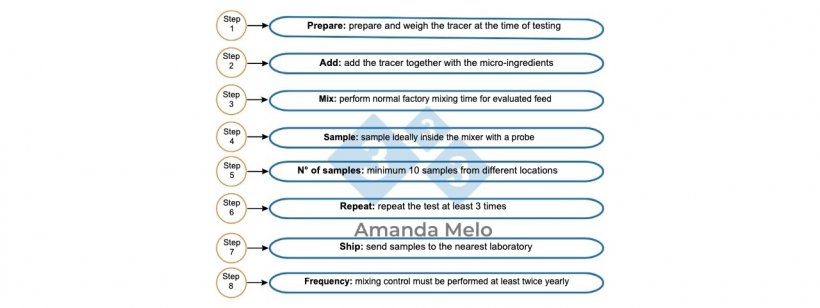
Mixing control is an essential part in addition to the physical analysis. Proper mixing must ensure that a 10-gram portion of feed contains the right proportion of the different ingredients. The simplest, quickest, and cheapest method to do this is by using microtracers, however, this method can have a high rate of error (> 10%) (Klein 2016). Another method that is very accurate, although much more expensive, could be the atomic absorption analysis of microminerals such as selenium or manganese.
Figure 2, below, outlines the mixing quality test step-by-step.

Mixing control is one of the indispensable physical analyses.
Table 2. Parameters of a good mixer and their optimum values.
| Parameter | Optimal value |
|---|---|
| Mixing quality | ≤ 5% coefficient of variation |
| Leaks | There should be no leaks |
| Residues at the bottom | ≤ 0.2% |
Source: Klein A. 2016
Chemical analysis
Also known as bromatological analyses, they can be divided into two main groups: nutritional analyses and quality analyses.

Nutritional analyses are used to check that processed feeds comply with the expected nutritional profile.
In the swine industry, the following are generally analyzed: moisture, crude protein, crude fiber, neutral detergent fiber, acid detergent fiber, ethereal extract, and ash, with moisture being one of the most important values. Moisture higher than specifications can result in loss of chemical stability, increased microbiological spoilage, and a general decrease in quality.
Some farms use calcium carbonate or oyster shell and phosphate in their various presentations in their formulations. It is essential to perform periodic calcium and phosphorus analysis of these ingredients, especially the calcium in calcium carbonate and the oyster shell , which can vary continuously.
Quality analyses are used to characterize and evaluate ingredients and feedstuffs. Considering the raw materials commonly used on-farm, the most important analyses are for urease activity and protein solubility for soybean by-products, as well as peroxide and acid values for oils and fats. These indicators can directly affect protein availability and digestibility, both in terms of feed intake and animal performance.
Table 3. Expected optimum values of urease activity and protein solubility for heat-treated whole soybeans and soybean by-products (e.g., soybean meal, soybean expeller).
| Heat-treated whole soybeans and products | |
|---|---|
| Parameter | Optimal value |
| Urease activity | ≤ 0.2 |
| Protein solubility (in KOH) | 80 - 85% |
Source: Butolo, 2002
Table 4. Expected optimum values of the quality parameters for vegetable oils and animal fats.
| Vegetable oils and animal fats | |
|---|---|
| Parameter | Optimal value |
| Rancid odor | Absent |
| Acid value | As stated in the contract |
| Peroxide value | < 10meq/kg |
| Impurities | < 0.15% |
Source: Fedna, 2002
It is important to bear in mind that the acid value is agreed upon in the raw material purchase contract.
Microbiological analysis
These analyses allow us to determine the level of contamination by microorganisms which can be detrimental to animal health. The main microbiological analyses are general coliform count - an important indicator of factory hygiene, the presence of E. coli, and Salmonella. These analyses are recommended mainly for raw materials of animal origin, which are the most prone to high contamination by microorganisms.
Table 5. Acceptable values of microorganisms in raw materials of animal origin.
| Raw materials of animal origin | |
|---|---|
| Parameter | Optimal value |
| Aerobic count | < 106 ufc/g |
| Coliform count | < 103 ufc/g |
| E. coli | Absent ufc/g |
| Salmonella | Absent ufc/25 g |
Source: Fedna; 2002
Microorganisms do not always cause health problems in animals, this will depend on the level of contamination and the category of pigs that will consume the feed, but it is an indicator of hygiene in the feed production process.
Mycotoxins produced by fungi present in raw materials of plant origin directly affect the health and productivity of pigs, which is why they are essential to include in quality control in order to determine the suitability of raw materials, their strategic use, and the need to add mycotoxin sequestering agents. Due to the high cost of these analyses, it is not feasible to analyze all the raw materials of plant origin used, but it is necessary to create a sampling and analysis strategy that is as representative as possible.
Table 6. Acceptable mycotoxin values for pigs.
| Mycotoxins | Limit |
|---|---|
| Zearalenone | 100 ppb |
| Fumonisin | 2 ppm |
| T2 toxin | 100 ppb |
| Aflatoxins | 20 ppb |
| Deoxynivalenol | 1 ppm |
| Ochratoxin | 50 ppb |
Source: Food Codex (Deoxynivalenol committee) 2003; FAO 2003
It is important to bear in mind that mycotoxins can have a synergistic effect on each other so that, if more than one mycotoxin is present, it is possible to observe negative effects on animals even if the contamination of each one is below the acceptable level.
These are the main quality controls that must be carried out to guarantee the quality of raw materials and feeds. Undoubtedly, doing them requires effort and an economic cost, however, the cost of not doing these controls is exponentially higher if we think of the damage they can cause to the animals.


