Thermoneutrality conditions for pigs are often surpassed in countries with warm climates, especially during the summer months. Heat stress is not a main cause of pig mortality however it causes a significant decrease in fattening pigs growth rate. Thus, the decrease is most pronounced in finishing pigs than it is in piglets or lighter pigs.

Overall, pigs try to combat the effects of excessive heat by two methods:
♦ Increasing heat dissipation: Pigs lie on the ground trying to maximize their body surface in contact with it. They also increase their breathing rate by panting. This increased breathing rate also results in increased evaporation of water in the lungs (this process is called evaporative cooling). Remember pigs do not have a sweat mechanism.
♦ Reducing heat production: All metabolic processes, including ingestion, digestion and absorption of nutrients, generate heat. Thus, pigs will reduce their feed intake in order to reduce the amount of heat they need to dissipate. This voluntary reduction of intake results in a decrease in feed consumption. In pigs ≥ 50 kg, this decrease in feed consumption starts when the effective temperature exceeds 20 °C.
This article will review, from a practical point of view, some of the strategies available to reduce the impact of high temperatures on fattening pigs, and will quantify their beneficial effects using a simulator designed specifically for the fattening phase.
Our baseline conditions are a specific genetic make-up (Pietrain), and extreme finishing conditions: a constant 30 °C temperature, a density of 0.70 m2 per pig, and normal housing and comfort conditions (60% humidity, adequate barn isolation, 2.5% mortality). An initial 3-feed program will be used: pre-finishing (30 kg / pig), growth1 (55 kg / pig) and growth2 (rest of intake), up to a live weight of 100 kg in all cases.
Improvement of environmental conditions
Heat decrease: The fastest way to counteract the effect of heat on the growth of pigs is obviously decreasing it.
♦ This can be achieved by lowering the heat load in the barn, by means of a correct orientation and adequate insulation. The simulation shows the improvement of all productive parameters and the reduction in feeding costs achieved by improved insulation (Table 1)
Table 1. Effect of barn insulation on fattening pigs performance.
| Isolation | Fattening period, days | Final weight, kg | ADG, g/d | Feed, kg/day | FCR | Feed costs/kg replacement, €/kg |
| Adequate | 140.0 | 100.0 | 572 | 1.46 | 2.56 | 0.673 |
| Scarce | 155.4 | 100.0 | 516 | 1.36 | 2.64 | 0.694 |
| Exceptional | 121.7 | 100.0 | 659 | 1.63 | 2.48 | 0.653 |
Source: Watson simulation, unpublished data
♦ By using cooling systems (cooling, misting, etc.) that manage to reduce ambient heat. The simulation shows an increase in slaughter weight and ADG as temperature decreases (Table 2.)

Table 2: Effect of barn temperature on fattening pigs performance.
| Ambient temperature | Fattening period, days | Final weight, kg | ADG, g/d | Feed, kg/day | FCR | Feed costs/kg replacement, €/kg |
| 30º | 140.0 | 100.0 | 572 | 1.46 | 2,56 | 0.673 |
| 28º | 125.1 | 100.0 | 641 | 1.59 | 2,48 | 0.659 |
| 26º | 120.5 | 100.0 | 666 | 1.66 | 2,49 | 0.657 |
| 24º | 117.1 | 100.0 | 686 | 1.71 | 2,49 | 0.656 |
| 22º | 115.3 | 100.0 | 697 | 1.74 | 2,50 | 0.654 |
Source: Watson simulation, unpublished data
♦ Although we might think that the decrease in density should have a positive effect on growth, the results suggest there is no significant improvement, not even with densities of 1m2 / pig. This could be explained by the important decrease in consumption caused by heat (Table 3.)
Table 3: Effect of density at 30 ºC temperature on fattening pigs performance.
| Density | Fattening period, days | Final weight, kg | ADG, g/d | Feed, kg/day | FCR | Feed costs/kg replacement, €/kg |
| 0.70 m2/pig | 140.0 | 100.0 | 572 | 1.46 | 2.56 | 0.673 |
| 0.60 m2/pig | 139.9 | 100.0 | 572 | 1.46 | 2.55 | 0.671 |
| 0.82 m2/pig | 139.5 | 100.0 | 574 | 1.47 | 2.55 | 0.670 |
| 1.00 m2/pig | 139.2 | 100.0 | 576 | 1.46 | 2.54 | 0.688 |
Source: Watson simulation, unpublished data
Changes in the feeding program
If we use the simulation model to optimize the initial program by growth, we obtain Figure 1; the higher the feed consumption in phases 1 and 2, the greater the ADG. If we optimize it by costs, they also turn out to be lower the higher the feed consumption in phase 2 (Figure 2.) Line 1 of Table 4 shows the baseline situation, whereas line 2 shows this same feeding program optimized by ADG.
Another solution would be to increase the amino acid/energy (Aa/EN) ratio of all feeds. Line 3 of Table 4 shows the same initial program with a 6% higher Aa/EN ratio, and the results are similar to the previous one. Line 4 shows the latter optimized by growth, with even better technical and economic indicators.
Last but not least, it is important to highlight the advantages of pellets over meal feed, both in growth and conversion and costs (Table 6.)
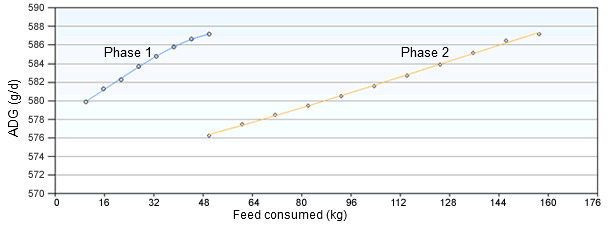
Figure 1. Representation of the average daily gain in relation to feed consumed when optimizing the initial program by growth.
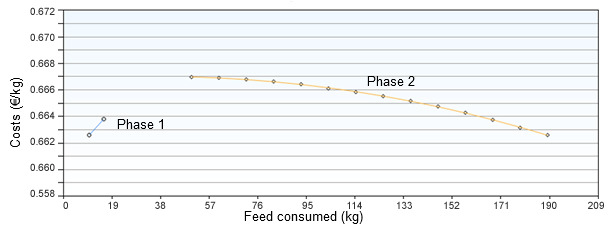
Figure 2. Representation of feed costs in relation to feed consumed when optimizing the initial program by feed costs.
Table 4. Changes depending on the feeding program.
| Feeding program | Fattening period, days | Final weight, kg | ADG, g/d | Feed, kg/ day | FCR | Feed costs/kg replacement, €/kg |
| Initial 3-feed program | 140.0 | 100.0 | 572 | 1.46 | 2.56 | 0.673 |
| Initial program optimized by ADG | 136.7 | 100.0 | 587 | 1.44 | 2.46 | 0.668 |
| Initial program + 6% Aas | 135.8 | 100.0 | 590 | 1.47 | 2.49 | 0.671 |
| Initial program + 6% Aas optimized by ADG | 132 | 100.0 | 607 | 1.44 | 2.37 | 0.662 |
Source: Watson simulation, unpublished data
Table 5. Feed consumption in each phase depending on feeding program.
| Feed consumption, kg | Phase 1 pre-fattening |
Phase 2 growing |
Phase 3 finishing |
Total |
| Initial 3-feed program | 30< | 55 | 118 | 203 |
| Initial program optimized by ADG | 50 | 145 | 195 | |
| Initial program + 6% Aas | 30 | 55 | 112 | 197 |
| Initial program + 6% Aas optimized by ADG | 50 | 139 | 189 |
Source: Watson simulation, unpublished data
Table 6: Effect of feed presentation on fattening pigs performance.
| Feed presentation | Finishing days | Final weight, kg | ADG, g/day | Feed, kg/day | FCR | Feed costs/kg replacement, €/kg |
| Pellet | 140.0 | 100.0 | 572 | 1.46 | 2.56 | 0.673 |
| Meal | 144.4 | 100.0 | 555 | 1.53 | 2.75 | 0.715 |
Source: Watson simulation, unpublished data
Conclusions
The best and most economical solution to reduce the impact of heat stress on finishing pigs is to reduce the temperature within the barn improving isolation and using appropriate cooling systems.
From the point of view of nutrition, the solution will be to increase the Aa/EN ratio in the feeds, either increasing pre-finishing and growth feeds intake, or increasing the amino acid content of all feeds.
Finally, we must bear in mind that these simulations are carried out, for teaching purposes, at a constant temperature of 30 °C throughout the fattening phase, which does not normally happen in field conditions. Using a simulator that takes into account all economic, nutritional and environmental factors of the farm is helpful to assess the technical and economic implications of changes in management, housing and feed.


