PRRS virus continues to be a formidable foe
Despite years of research and experience with PRRS virus, the disease remains costly to pork producers in nearly every country. Results from a recently published study estimated the total cost of productivity losses to US producers at US$664 million annually (Holtkamp et al., 2013). That is a slight increase from the US$560 million estimate of productivity losses from an economic analysis published in 2005 (Neumann et al., 2005). Roughly 40% of the increase is due to inflation but the bottom line is that the PRRS virus continues to be a formidable foe and progress on reducing the economic impact of the virus is not occurring.

Productivity losses are shifting from the growing pig herd to the sow herd in the US
Since 2005, it appears that some progress has been made in dealing with productivity losses caused by PRRS virus in the growing pig but these were offset by greater losses in the sow herd. In the 2005 study, losses in the sow herd accounted for only 12% of the total cost of PRRS compared to 45% in the current study.
For the entire US sow herd, including those affected and not affected by PRRS virus, reproductive efficiency was reduced by 1.44 pigs weaned per breeding female per year which translates into a loss of 8.30 million pigs weaned per year. The total annual cost of productivity losses in US sow herds was estimated to be US$302 million. The total annual cost of productivity losses in US growing pig herds was estimated to be US$362 million.
So what has changed since 2005? It is possible to speculate but reliable data to support such speculations is not available highlighting a significant gap in our knowledge and ability to monitor progress in fighting the PRRS virus. Methods used to eliminate the virus from sow herds and to increase the likelihood of weaning PRRS virus-free pigs from PRRS virus-infected sow herds have evolved significantly. In the US, use of vaccination, live virus inoculation, temporary closure of herds to introduction of new breeding replacements, and limited use of cross fostering to stop circulation of the PRRS virus in the sow herd following a PRRS outbreak have likely increased the number of PRRS virus-free groups of pigs being weaned. However, these strategies may have also impacted productivity in the sow herd or changed the incidence and severity of outbreaks in sow and growing pig herds. The emergence of PCV2 associated disease and widespread use of PCV2 vaccines since 2005 may also have impacted productivity losses attributed to PRRS virus but the extent is unknown.
How the estimates were made for the sow herd
Estimates of productivity losses due to PRRS virus in the current study were based on data compiled from a survey of 26 US swine veterinarians on the incidence and impact of PRRS virus, production records (2005 to 2010) from 80 commercial sow farms and 639 groups of growing pigs with known PRRS virus status.
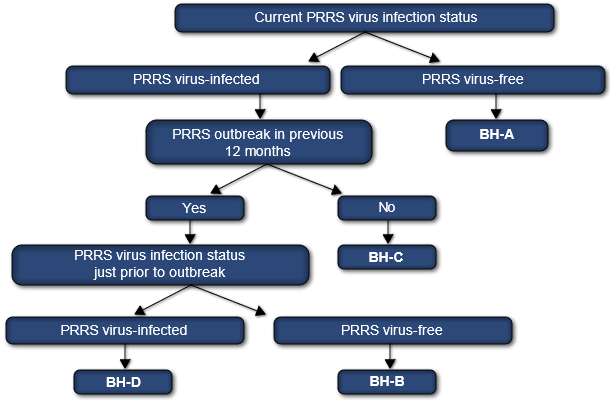
To capture the long-term effects of PRRS virus infection status and outbreaks on productivity a PRRS classification was determined for sow herds. The PRRS classification was based on 1) the PRRS virus infection status, 2) whether the herd experienced one or more PRRS outbreaks in the previous 12 months and when an outbreak had occurred in the previous 12 months, 3) the PRRS virus infection status immediately prior to the outbreak (Figure 1). Including the infection status immediately prior to the outbreak allowed for comparing losses in PRRS virus-free herds to losses due to re-breaks in PRRS virus-infected, i.e., partially-immune, herds. PRRS virus-infected herds were defined as AASV/PRRS-CAP categories I (PRRS virus-positive, unstable) and II (PRRS virus-positive, stable). PRRS virus-free herds were defined as AASV/PRRS-CAP categories III (provisionally PRRS virus-negative) and IV (PRRS virus-negative) (Holtkamp et al., 2011).

Figure 1. PRRS virus classification system for swine sow herds

Productivity losses in the sow herd
Estimates of productivity losses due to PRRS virus in the sow herd from both the survey of production records and the survey of veterinarians are in Table 1.
Table 1. Productivity estimates from survey of veterinarians and production records for sow herds by PRRS category.
| Item | Source | Values by PRRSV Category | Differences from BH-A | ||||||
| BH-A | BH-B | BH-C | BH-D | BH-B | BH-C | BH-D | |||
| Number pigs born alive/ litter |
Survey of veterinarians | 12.14 | 10.59 | 11.23 | 10.74 | -1.55 | -0.91 | -1.40 | |
| Production records | 11.6a | 10.6b | 11.2c | 11.0d | -1.0 | -0.4 | -0.6 | ||
| Pre-wean mortality percent farrowed (% of pigs born alive) |
Survey of veterinarians | 11.0% | 17.0% | 14.0% | 16.0% | +6.0% | +3% | +5% | |
| Production records | 12.2%a | 18.0%b | 12.6%a | 13.7%c | +5.8% | +0.4% | +1.5% | ||
| Number litters farrowed/mated female/ year |
Survey of veterinarians | 2.36 | 2.09 | 2.21 | 2.13 | -0.27 | -0.15 | -0.23 | |
| Production records | 2.45a | 2.33b | 2.39b | 2.38b | -0.12 | -0.06 | -0.07 | ||
| Pigs weaned/mated female/year |
Survey of veterinarians | 25.5 | 18.4 | 21.2 | 19.2 | -7.1 | -4.3 | -6.3 | |
| Production records | 25.0 | 20.3 | 23.4 | 22.6 | -4.7 | -1.6 | -2.4 | ||
Values with different superscripts are significantly different at p < 0.05
Statistical analysis was not done for values where superscripts are excluded
The largest impact on productivity, relative to PRRS virus-free herds (BH-A) was on herds that had a recent outbreak and were PRRS virus-free prior to the outbreak (BH-B). The number of pigs weaned per mated female per year in the year following the outbreak in the BH-B herds was 7.1 (from the survey of veterinarians) and 4.7 (from the production records) lower than those in BH-A herds.


