

Currently, the weaning-to-service interval (WSI) is one of the main indicators that explain farm performance. This interval is defined as the time between the weaning of a sow and its first subsequent service, and therefore, with the aim of having the lowest number possible of non-productive days (NPDs), it will always be interesting to minimize it. Nowadays we know that this interval is not only related to NPDs, but that it can have a greater impact than what we first thought.
Analysing the WSI of 481,288 post-weaning services corresponding to year 2017 in our database, we obtain the following distribution:

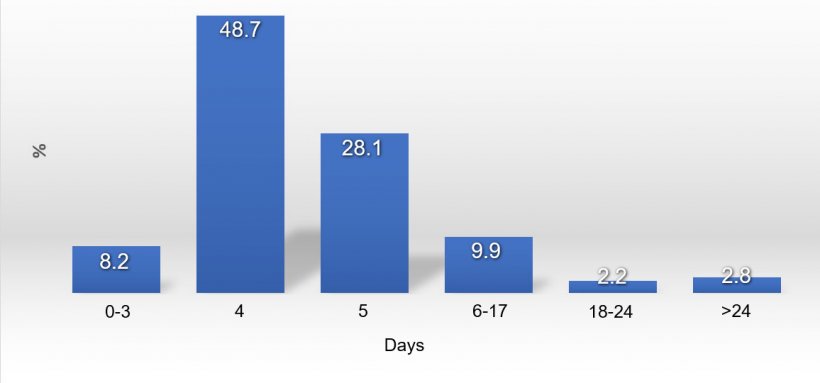
Graph 1. Distribution of the WSI in 2017
We can clearly see that 4 and 5 days are the most common WSIs, with 48.75% and 28.1%, respectively. In the following Table (Table 1) we show the results after the servicing of these two groups of sows regarding the farrowing rate (FR) and the prolificacy expressed as total piglets born (TB) in the following farrowing. We also show the composition of each group: its average age expressed as the average parity and the percentage of primiparous sows in each group.
Table 1. Performance after service depending on the WSI (average WSI: 5.7 days). Year 2017
| FR | TB | Average age (parity) | % of primiparous sows | |
|---|---|---|---|---|
| WSI4 | 89.5 | 15.7 | 3.5 | 17.8% |
| WSI5 | 87.4 | 14.9 | 3.3 | 23.4% |
Depending on the WSI, we can see an obvious difference regarding prolificacy, with better results for an WSI of 4 vs. 5 days; a fact that can be expected from a physiological viewpoint.
Next we show the results of the WSI4 and WSI5 groups according to their parity (Table 2). They are divided in 4 groups: Parity 1 (primiparous), Parity 2, Parity 3-6 and Parity ≥ 7 sows. According to the Table, the WSI4 group obtains better results in all the parities both in prolificacy (0.7-0.9 piglets more) and FR (between 1.3 and 2.8 % more).
Table 2. Performance after service depending on the parity and WSI. 2017.
| Parity 1 | |||
| FR (%) | TB | Difference in prolificacy | |
| WSI 4 | 87.6 | 15.3 | 0.8 |
| WSI 5 | 85.2 | 14.5 | |
| Parity 2 | |||
| FR (%) | TB | Difference in prolificacy | |
| WSI 4 | 90.3 | 16.1 | 0.9 |
| WSI 5 | 87.5 | 15.2 | |
| Parity 3-6 | |||
| FR (%) | TB | Difference in prolificacy | |
| WSI 4 | 90.1 | 15.9 | 0.8 |
| WSI 5 | 88.5 | 15.1 | |
| Parity ≥ 7 | |||
| FR (%) | TB | Difference in prolificacy | |
| WSI 4 | 87.8 | 14.5 | 0.7 |
| WSI 5 | 86.5 | 13.8 | |
To check if this difference in prolificacy between WSI4 and WSI5 varies depending on the productive performance on a farm (measured as piglets weaned/sow/year), we have created 2 subgroups based on this parameter. A first group is formed by farms with a production capacity of more than 30 piglets weaned /sow/year, whilst a second group is formed by those whose productivity is below 25 piglets weaned/sow/year.
Regarding the distribution of the WSI, and as shown in the following Table, we see that in both groups, the WSI concentrates the greatest percentages between days 4 and 5. Also, the farms with a PSY > 30 concentrate 78.4% of all the services, whilst in the case of the farms with a PSY < 25, they concentrate 67.0% of the services.
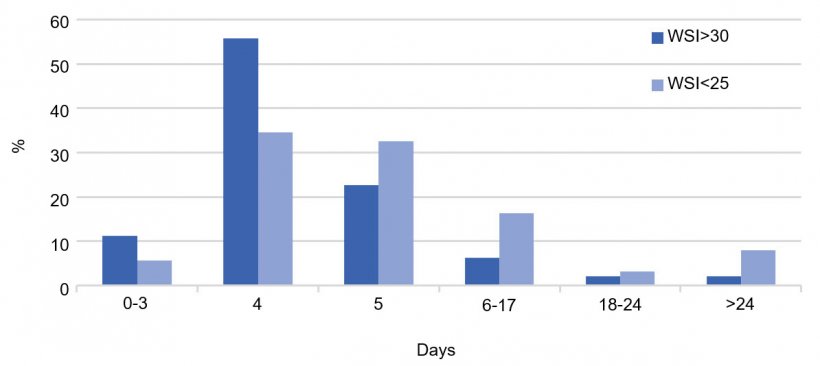
Graph 2. Distribution (%) of the WSI considering farm performance. Year 2017.
Next we analyse the groups PSY > 30 and PSY < 25 separately. In the PSY > 30 (Table 3), we can see that just like it happened in the global group studied before, the WSI seems to have a certain impact on the subsequent FR (except in the case of old sows, with ≥ 7 farrowings), as well as on the prolificacy in the following farrowing in a more noticeable way (1.0-1.5 piglets more in the WSI4 sows).
Table 3. > 30 PSY (average WSI: 5.2 days). Year 2017.
| Parity 1 | |||
| FR (%) | TB | Difference in prolificacy | |
| WSI 4 | 90.9 | 17.3 | 1.2 |
| WSI 5 | 89.1 | 16.1 | |
| Parity 2 | |||
| FR (%) | TB | Difference in prolificacy | |
| WSI 4 | 91.8 | 18.2 | 1.5 |
| WSI 5 | 89.7 | 16.7 | |
| Parity 3-6 | |||
| FR (%) | TB | Difference in prolificacy | |
| WSI 4 | 92.1 | 18.4 | 1.5 |
| WSI 5 | 91.0 | 16.9 | |
| Parity ≥ 7 | |||
| FR (%) | TB | Difference in prolificacy | |
| WSI 4 | 88.3 | 17.1 | 1.0 |
| WSI 5 | 90.4 | 16.1 | |
n the case of the farms with < 25 PSY (Table 4), we see the same effect, and the difference in numbers is greater in young sows with regard to the farrowing rate and lower with respect to prolificacy, being more stable for all the parities.
Table 4.- < 25 WPSY (average WSI: 6.1 days). Year 2017
| Parity 1 | |||
| FR (%) | TB | Difference in prolificacy | |
| WSI 4 | 86.6 | 13.8 | 0.4 |
| WSI 5 | 81.2 | 13.4 | |
| Parity 2 | |||
| FR (%) | TB | Difference in prolificacy | |
| WSI 4 | 88.1 | 14.6 | 0.3 |
| WSI 5 | 84.9 | 14.3 | |
| Parity 3-6 | |||
| FR (%) | TB | Difference in prolificacy | |
| WSI 4 | 86.8 | 14.5 | 0.4 |
| WSI 5 | 85.7 | 14.1 | |
| Parity ≥ 7 | |||
| FR (%) | TB | Difference in prolificacy | |
| WSI 4 | 86.5 | 13.2 | 0.3 |
| WSI 5 | 85.3 | 12.9 | |
Therefore, according to the results obtained, and although we are still waiting for a statistical analysis that confirms the significance of the results, the WSI determines, to a great extent, the FR and the TB in the following cycle, especially on high performance farms with more than 30 piglets weaned per sow per year. Regardless of the parity, if we also take into consideration that the weaning-to-service interval causes NPDs, there is no doubt that mating the sows around day 4 must be our goal.
