On a farm, the recording of great amounts of data is very common. Nevertheless, their under-use is, sadly, too frequent. A correct analysis of the data recorded continuously on the farm, especially of those that are not destined to be recorded in the management software, can be very useful for solving practical problems on the farm.
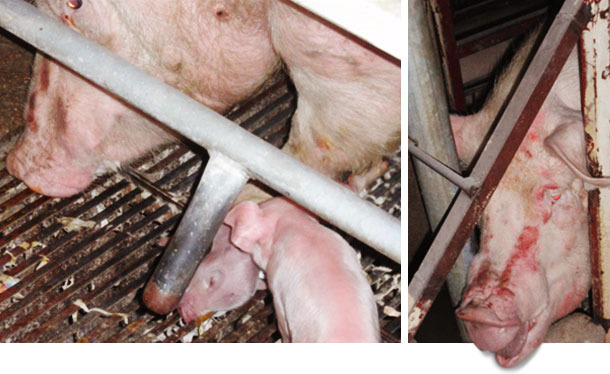
The real case explained in this article is a clear example of this. The farm is medium-sized (540 producing sows). We see aggressiveness in the sows, especially after farrowing, and up to 27% of them are treated with tranquilizers due to this reason (Figures 1 and 2). There is a high percentage of stillborn piglets (SB), lack of milk during the first days after the farrowing, a high percentage of pre-weaning mortality (PWM), especially due to crushings during the first hours of life and, as a direct consequence, a low number of weaned piglets per sow (Table 1).


Figure 1 and 2: Sows that are aggressive with their piglets and with the staff.
| Total born piglets | Live born piglets | % stillborn piglets | % mummified piglets | % preweaning mortality | Weaned piglets / litter | Weaned piglets / sow / year |
| 13.4 | 12.1 | 7.7 | 1.6 | 23 | 9.2 | 21.5 |
Table 1. Production figures.
We suspect that the causative factor of stress is the handling received by the sows during the farrowing and the first days of the lactation. Once having checked that other factors, such as feeding, temperature, and air circulation were correct, we decided to register and analyze the data related to the pre- and post-farrowing handling in order to confirm the suspicions.
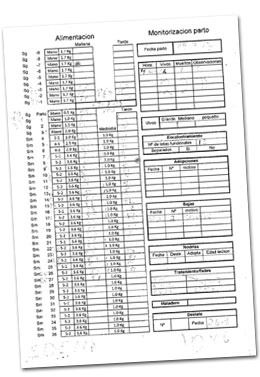
 Figure 3: farrowings index card |
1- Recording of data
The farm has farrowings index cards (Figure 3) that have several fields to be filled out. We emphasize the meticulous recording of the monitoring of the farrowing, the treatments carried out and the losses of piglets (especially the cause and their age).
We record 35 data for each farrowing for a total of 345 farrowings during a 3-month period, so the total figures are 12,075 data. So, it is essential to classify them in order to focus on the goals to be analyzed and, in this way, avoid losing information among a great set of figures.
It is important to highlight that the average age of the sows in each group is very similar, with values of 4.1-4.3 farrowings per sow.
2- Entering of the data
For the entering of the data, there are several "key areas" that it is interesting to analyze:
- Farrowing (TB, LB, SB, mummified piglets…)
- Fosterings, transfers of piglets, foster sows and average age of the piglets
- Losses, classification, and age
- Treatments carried out on the piglets
- Weaning, abattoir, and average of the history of the sow
- PROCEDURES CARRIED OUT ON THE SOWS. These are the most interesting data, because through them we can tell if the handling affects the production performance.
- During the farrowing (oxytocin, tranquilizers, assistance during the farrowing)
- Identification of mastitis, days of lactation, treatments
With respect to the level of intervention on the sows, we distinguish between three different situations: assisted farrowing (an intervention has been needed), NON-assisted farrowing at NIGHT (there is no assistance because there is nobody present) and, lastly, NON-assisted farrowing during the DIURNAL hours (non-assisted because it is not necessary). The intensity of the intervention on the sows is also classified (Table 2), and also if it is necessary to administer a tranquilizer due to aggressiveness towards the litter.

Table 2. Levels of intervention during the farrowing
| 1 | one time in an hour |
| 2 | two times in an hour |
| 3 | three or more times in an hour |
The identification of mastitis is also classified with respect to the day in which the sow is treated: before/after the 5th day of lactation.


