3- Analysis of the results obtained
Once the first 219 farrowings were recorded, we analysed them and started to make decisions.

In the first place, we confronted the data of the assisted farrowings vs. the NON-assisted farrowings (Table 3). The prolificacy results were not affected, so we focused on the pre-weaning mortality (PWM) results:
Table 3. Pre-weaning mortality and its main causes in assisted and non-assisted farrowings
| Effect of the assistance | % total PWM | % crushed | Non-viable | Runts |
| NO (n = 145) YES (n = 74) |
16.59 18.78 |
10.43 12.83 |
0.24 0.53 |
0.15 0.14 |
| SEM | 0.209 | 1.457 | 0.003 | 0.062 |
| Probability TB | 0.002 | 0.012 | < 0.001 | 0.031 |
- The PWM is higher in the sows that received assistance.
- The percentage of crushed and non-viable piglets is higher in the sows that received assistance.
These indications make us go a step further and confront the NON-assisted sows' data, in this case differentiating them between the farrowings at night and the diurnal farrowings, in order to distinguish a possible stressing effect during the day. The results are shown in Table 4:
Table 4. Total pre-weaning mortality and its main causes in NON-assisted farrowings during the day hours, and in the nocturnal NON-assisted farrowings.
| Non-assisted farrowings | % total PWM | % crushed | % Non-viable | % Runts |
| Day (n = 63) | 22.78 | 14.56 | 0.63 | 5.06 |
| Night (n = 82) | 16.25 | 10.11 | 3.61 | 0.72 |
The NON-assisted sows during the day, which are animals with a normal progress of their farrowing, show a higher PWM. This increase is based, mainly, on the % of crushed piglets and the % of runts. This is, the sows that are being cared for crush more piglets than the sows that farrow alone at night.
Nevertheless, the % of losses due to non-viable piglets is higher in the case of the sows with nocturnal farrowings. It is suspected that they are piglets that become cold during the night, and they are recorded as such.
Does the intensity of the assistance during the farrowings have an influence on the PWM?
Next we analyse the effects of the intensity of the assistance during the farrowing (Figure 6), obtaining very clear results in the "level 3" assisted sows (3 or more interventions in an hour), in which we find a higher PWM % especially due to crushings, and a lower number of weaned piglets (Table 5).
Table 5. Total pre-weaning mortality and its main causes depending on the level of assistance of the sows
| Intensity of the assistance | PWM total % | % crushed piglets | Non-viable piglets | Runts | No. of weaned piglets |
| 0 (n = 145) | 16.59 | 10.41 | 0.24 | 0.14 | 9.21 |
| 1 (n = 28) | 14.21 | 9.27 | 0.49 | 0.03 | 9.48 |
| 2 (n = 14) | 19.89 | 10.89 | 0.90 | 0.23 | 9.45 |
| 3 (n = 32) | 22.43 | 16.76 | 0.41 | 0.22 | 7.83 |
| SEM | 0.474 | 3.279 | 0.182 | 0.142 | 0.526 |
| Probability TB | 0.001 | 0.024 | >0.001 | 0.036 | 0.002 |
4- Measures carried out

It is in this moment when the first decisions are made and the staff is trained with regard to the handling of the sows during the farrowing and the first days of lactation:
- the intervention during the farrowing, that reaches 50% of the sows that farrow, is limited
- "category 3" is forbidden
- we show how to identify mastitis correctly, because 39% of the sows are being treated due to this cause on the same day of the farrowing (Figure 4).
- No other handling factor is modified in order not to hide the possible results.
Figure 4. Reduction of the intervention on the sows after the training of the staff
5- Results obtained
After the implementation of the new handling measures on the farm, we still record the data. When comparing them with the previous ones, we see very clear results.
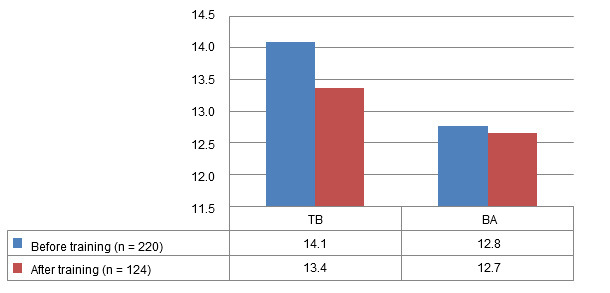
Although the number of total born (TB) piglets is lower in the group of sows that do not suffer stress during the farrowing, when reducing in a statistically significant way the % of SB piglets, going from 7.2% before the training to 6.5% after the training (p < 0.0001), we get to equal the number of LB piglets Figure 5).

Figure 5. Prolificacy results before and after the decision making
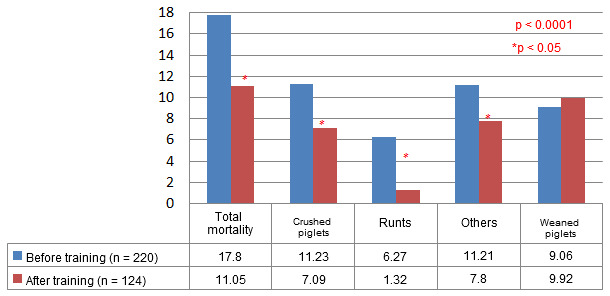
With respect to the PWM, the global result is reduced to a 6.75%, and this drop is mainly due to the percentage of crushed piglets and the runts due to the lack of milk, obtaining, in this way, almost a weaned piglet more (Figure 6).

Figure 6. Mortality results and weaned piglets before/after the decision making
Conclusions
The results obtained confirm to us the suspicion that the stress sustained by the sows is due to an excessive and inappropriate intervention on them during the farrowing and the first hours of life of the piglets, causing a severe increase of the PWM and, as a consequence, a low number of weaned piglets. After implementing the necessary changes relative to the handling of the farrowings, important improvements were obtained in both parameters, and the aggressiveness of the sows towards their litters dropped.
So, a correct recording of the data on the farm and their appropriate analysis and interpretation is a very useful tool for taking well-reasoned and correct decisions.


