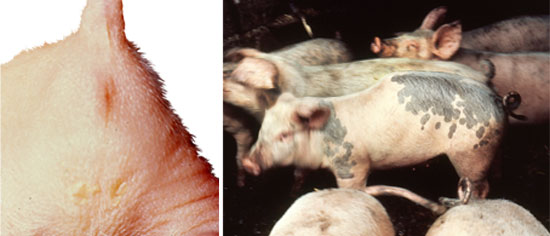
 |
| Mortality, and economic loss, was highest in this study for splayleg |
However, what are the real economic losses that can be attributed to defects? The largest and most detailed analysis was undertaken nearly forty years ago by Done, Reed and Deeble in 1972. They reported on the incidence of genetic defects recorded by trained technicians in the progeny of the first twenty ‘viable’ litters of all UK Large White and Landrace A.I. boars.
In total, more than 60 defects were looked for in the investigation and 13 defects were considered to result in death or culling. As the table shows the estimate of mortality varied across the defects, ranging from 5% to 100%:
| % Incidence | |||
| Large White Sire | Landrace Sire | % Death or culled | |
| Splayleg | 0.14 | 1.25 | 50 |
| Inquinal/scrotal hernia | 0.44 | 0.67 | 5 |
| Atresia ani | 0.14 | 0.31 | 100♂/50♀ |
| Pitryisis rosea | 0.08 | 0.33 | 5 |
| Umbilical hernia | 0.16 | 0.05 | 10 |
| Tremors | 0.02 | 0.09 | 100 |
| Bent legs | 0.03 | 0.05 | 5 |
| Thickened forelimbs | 0 | 0.03 | 5 |
| Mandible | 0.02 | 0 | 50 |
| Kyphosis | 0 | 0.02 | 5 |
| Cranioshisis | 0 | 0.02 | 100 |
| Hydrocephalus | 0 | 0.02 | 100 |
| Eye defects | 0 | 0.02 | 100 |
| Total % | 1.02 | 2.84 | |
An economic model was developed that assessed financial loss through the pyramid from nucleus to multiplier to commercial herd on a per litter basis for traits with an incidence higher than 0.10%. This gene-flow model assumed ten pigs born per litter and concluded that the cost of genetic defects was US$0.36 for a Large White sired litter and US$1.13 for a Landrace-sired litter. Since these data were published it should be noted that litter sizes have increased and the estimated marginal value of a weaner pig has increased 11 fold since 1972. Thus, the current economic loss from defects is likely to have increased very significantly.

| Atresia – inevitably leads to death and economic loss | Kyphosis – common in some herds but most pigs survive and grow normally |


| Number of defects | Number of deaths/culls | % of deaths/culls | |
| Inquinal/scrotal hernia | 2026 |
81 |
4.0 |
| Umbilical hernia | 953 |
48 |
5.0 |
| Cryptorchid |
819 |
2 |
0.2 |
| Female genitalia | 74 | 0 | 0 |
| Epitheliogenesis imperfecta | 2 |
2 |
100.0 |
| Splayleg | 5 | 2 | 40.0 |
| Other | 194 | 35 | 18.0 |
| Total defects | 4355 | 243 | |
| Total pigs | 196,424 | ||
| % affected | 2.217 | 0.124 |
In summary, in this population, the total incidence of defects was 2.22%. Of these roughly one pig in every twenty (5.6%) either died or was euthanised due to a defect, representing an overall percentage of 0.124%.
Assuming that the above data are representative of other world pig populations it is possible to estimate the annual cost of genetic defects. The latest FAO statistics (see here) report world slaughterings in 2009 of 1,337,205,493 pigs. Using a gross margin of US$30 per ‘lost’ pig indicates that the global value of deaths and culls due to genetic defects was US$49.74 million. This is likely to be less than the economic losses from disease like PCVAD and PRRS but suggests a significant financial impact on world pig production.


