Farm description
It is a 17000-sow Brazilian farm, PRRS negative, with internal replacements and no introduction of animals from outside.

Case onset
The problem does not appear suddenly, the farm owner points out two main problems:
- Historically, low general prolificacy.
- A decline in performance in recent months, but without a specific parameter being affected. According to the farmer, “the sows performance is worse in general terms."
Case analysis
First, we analyse the historical production data of the farm, to quantify the two areas the owner mentioned and to detect possible trends or temporal variations.
Table 1. Analysis of productive trends, 6 periods of 12 months.
|
1/4/2010 31/3/2011 |
1/4/2011 31/3/2012 |
1/4/2012 31/3/2013 |
1/4/2013 31/3/2014 |
1/4/2014 1/3/2015 |
1/4/2015 31/3/2016 |
Total | Average | |
| Total No. of services | 4,252 | 4,364 | 4,479 | 4,490 | 4,583 | 4,568 | 26,736 | 4,456 |
| Repeat services | 287 | 273 | 372 | 298 | 295 | 319 | 1844 | 307 |
| Percent repeat services | 6.7% | 6.3% | 8.3% | 6.6% | 6.4% | 7.0% | 6.9% | |
| No. of farrowings (litters) | 3600 | 3848 | 3808 | 3853 | 3966 | 4105 | 23180 | 3863 |
| Total piglets born | 46,468 | 51,488 | 50,806 | 52,529 | 53,024 | 53,165 | 30,7480 | 51,247 |
| Average Total born/litter | 12.9 | 13.4 | 13.3 | 13.6 | 13.4 | 13.0 | 13.3 | |
| Total pigs born alive | 41,667 | 47,049 | 46,557 | 47,694 | 47,712 | 48,149 | 278,828 | 46,471 |
| Average born alive/litter | 11.6 | 12.2 | 12.2 | 12.4 | 12.0 | 11.7 | 12.0 | |
| Total Stillborn | 2,602 | 2,417 | 2,369 | 3,212 | 3,928 | 3,520 | 18,048 | 3,008 |
| (% of Total born) | 5.6% | 4.7% | 4.7% | 6.1% | 7.4% | 6.6% | 5.9% | |
| Total mummified | 2,199 | 2,022 | 1,880 | 1,623 | 1,384 | 1,496 | 10,604 | 1,767 |
| (% of Total born) | 4.7% | 3.9% | 3.7% | 3.1% | 2.6% | 2.8% | 3.4% | |
| Farrowing rate | 88.8% | 88.1% | 85.3% | 86.1% | 88.1% | 88.4% | 87.5% | |
| Pre-weaning deaths | 3,504 | 3,709 | 2,937 | 3,303 | 2,854 | 2,952 | 19,259 | 3,210 |
| (% of born alive) | 8.4% | 7.9% | 6.3% | 6.9% | 6.0% | 6.1% | 6.9% | |
| Weaned sows | 3,634 | 3,857 | 3,776 | 3,833 | 3,966 | 4,120 | 23,186 | 3,864 |
| Total weaned piglets | 38,284 | 43,135 | 43,143 | 43,819 | 43,883 | 42,999 | 255,263 | 42,544 |
| Pre-weaning mortality | 8.7% | 8.6% | 6.5% | 7.5% | 8.5% | 10.8% | 8.4% | |
| Pigs weaned /litter weaned | 10,5 | 11,2 | 11,4 | 11,4 | 11.1 | 10.4 | 11.0 | |
| Average age at weaning | 23.2 | 21.4 | 21.3 | 20.6 | 19.5 | 19.5 | 20.9 | |
| Sow inventory | ||||||||
| Average No. of females | 1,912 | 2,024 | 1,980 | 2,022 | 1,953 | 1,974 | 1,978 | |
| Average No. of gilts | 377 | 407 | 340 | 390 | 284 | 265 | 344 | |
| Average No. of sows | 1,535 | 1,617 | 1,640 | 1,632 | 1,669 | 1,709 | 1,634 | |
| Average female age (parity) | 2.1 | 1.7 | 1.8 | 2.0 | 2.2 | 2.3 | 2.0 |
The data confirm the owner's information:
- The overall prolificacy of the farm has always been low, although it has recently dropped by practically half a piglet compared to previous periods.
- Performance in the farm has worsened, not generally, but specifically in the farrowing house, and mainly related to a pre-weaning mortality increase.
The following are also evident:
- During the last 5 years, the average parity has increased, from 1.7 litters to the current 2.3. This fact can have an influence on several productive parameters.
- Parallel to the slow but progressive increase in farm size, lactation length has dropped from 23.2 days, 6 years ago, to the current 19.5. Logically, this reduction may have an effect on prolificacy, which will be discussed again later.
Low prolificacy
The study of this parameter is based mainly on productive data analysis. The distribution by parity number of the total born in the last 12 months is as follows:
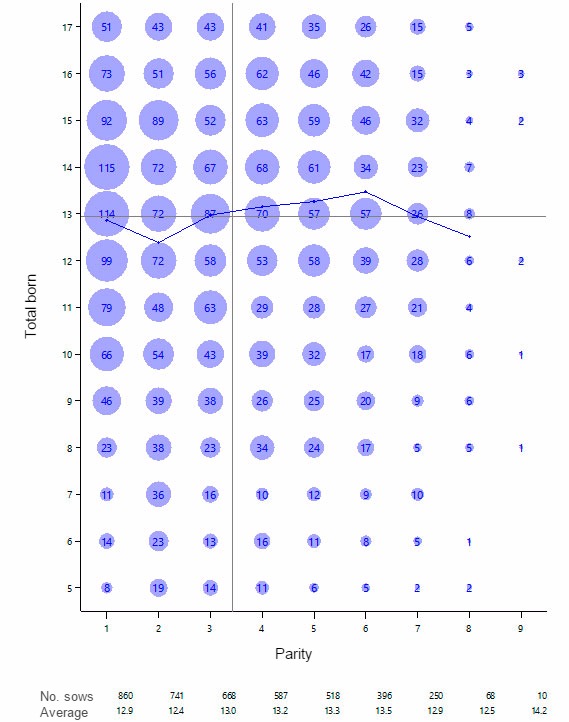
The graph shows that prolificacy goes down clearly after the first lactation. In fact, although gilts are usually one of the groups with less prolificacy, theirs prolificacy is, on average, almost equal to the global one. Therefore, the problem seems to be concentrated in the multiparous sows. Since lactation length has been decreasing, the effect of this lactation length on subsequent prolificacy is being analysed.
Table 2.Mating results by previous lactation length, April 10-March 16
| Total serv. | Matings per serv. | Repeat. % | Average age of sows (parity) | Farr. rate | Concep. rate |
Av. Born alive |
Av. Stillborn | Av. Total born | Av. weaned | % more 125 days | |
| 18 days | 501 | 1.7 | 8.8% | 2.1 | 82.4% | 86.2% | 11.2 | 0.8 | 12.4 | 10.8 | 95.2% |
| 19 days | 1,109 | 1.7 | 11.1% | 2.4% | 80.7% | 83.0% | 11.5 | 0.7 | 12.6 | 10.8 | 97.4% |
| 20 days | 1,872 | 1.6 | 9.1% | 2.5 | 82.2% | 85.8% | 11.8 | 0.8 | 12.9 | 11.0 | 96.2% |
| 21 days | 4,761 | 1.6 | 8.1% | 3.2 | 84.5% | 87.8% | 12.0 | 0.9 | 13.2 | 10.6 | 96.2% |
| 22 days | 4,799 | 1.4 | 6.6% | 3.3 | 81.8% | 88.1% | 12.2 | 0.8 | 13.5 | 10.8 | 93.0% |
| 23 days | 2,240 | 1.2 | 8.8% | 2.9 | 83.7% | 86.0% | 12.3 | 0.7 | 13.5 | 11.0 | 97.5% |
| 24 days | 987 | 1.1 | 10.0% | 2.5 | 82.0% | 84.2% | 12.1 | 0.7 | 13.3 | 11.2 | 97.5% |
| 25 days | 527 | 1.1 | 10.6% | 2.3 | 84.6% | 85.0% | 11.9 | 0.6 | 12.9 | 11.0 | 99.1% |
| 26 days | 438 | 1.0 | 13.9% | 2.4 | 81.5% | 82.5% | 12.2 | 0.5 | 13.3 | 11.2 | 99.1% |
| Total | 18,922 | 1.4 | 8.5% | 2.9 | 82.9% | 86.5% | 12.0 | 0.8 | 13.2 | 10.8 | 98.1% |
| Standard deviation | 0.64 | 1.72 | 3.37 | 1.32 | 3.63 | 3.51 |
Between 18 and 23 days, the difference is more than one piglet. Therefore, the short duration of lactation is one of the causes of low prolificacy, and this effect has increased in recent periods, as lactation length has decreased.
On the other hand, the farm has, in addition to the GP sows, two different genetic lines. Prolificacy is analysed by parity of both genetic lines.
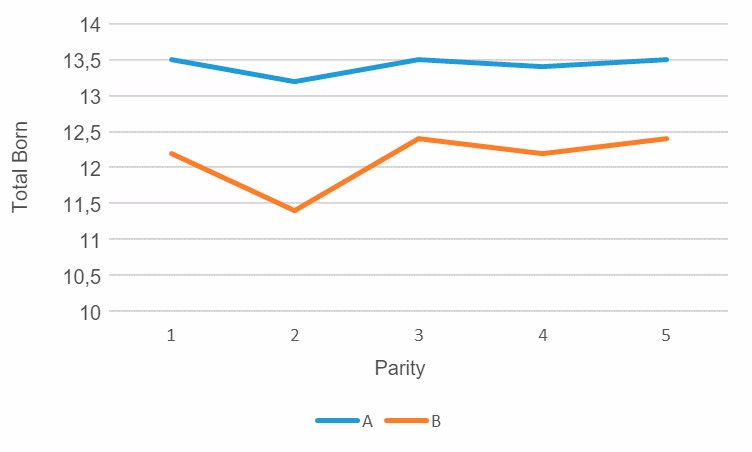
Genetics B has clearly lower prolificacy than genetics A. Therefore, genetics B is clearly penalizing global prolificacy. This graph also shows an important finding, ie, that in both genetic lines, the first farrowing is one of the most prolific, reinforcing the hypothesis of prolificacy problems associated to multiparous sows.
Last year d
ecrease
Table 1 shows that the reduction in efficiency in the last period was mainly due to an increase in pre-weaning mortality. However, further analysis of the gestation data shows that parameters such as irregular repeats and abortions have increased in this last period over the previous three.
Table 3.Gestation results, 6 periods of 12 months.
| 01-apr-10 31-mar-11 | 01-apr-11 31-mar-12 | 01-apr-12 31-mar-13 | 01-apr-13 31-mar-14 | 01-apr-14 31-mar-15 | 01-apr-15 31-mar-16 | |
| Total services | 1,719 | 3,538 | 4,418 | 4,485 | 4,577 | 4,565 |
| (as total % ) | 7.4% | 15.2% | 19.0% | 19.2% | 19.6% | 19.6% |
| Return services | 119 | 233 | 370 | 299 | 295 | 319 |
| Return rate | 6.9% | 6.6% | 8.4% | 6.7% | 6.4% | 7.0% |
| Av. return interval | 26.1 | 26.4 | 23.6 | 26.1 | 31.9 | 26.3 |
| Early returns (<18) | 2 | 6 | 1 | 6 | 0 | 4 |
| Regular return -1ª (18-25) | 68 | 127 | 286 | 195 | 149 | 191 |
|
Irregular return (26-37) |
36 | 75 | 69 | 55 | 41 | 86 |
| Regular return-2ª (38-46) | 10 | 20 | 9 | 28 | 35 | 18 |
| Delayed returns (>46) | 3 | 5 | 5 | 15 | 70 | 20 |
| Regular-1ª to regular -2ª | 6.80 | 6,35 | 31,78 | 6,96 | 4,26 | 10,61 |
| Regular to irregular | 2,17 | 1.96 | 4.28 | 4.05 | 4.49 | 2.43 |
| Abortions | 37 | 165 | 101 | 98 | 110 | 134 |
| Nulliparous abortions | 16 | 22 | 10 | 8 | 17 | 15 |
| Sow abortions | 21 | 143 | 91 | 90 | 93 | 119 |
In the farrowing house, in addition to the higher pre-weaning mortality, there is an increase in the number of sows that wean 0 piglets.
Table 4- No. of weanings, 6 periods of 12 months.
| 01-apr-10 31-mar-11 | 01-apr-11 31-mar-12 | 01-apr-12 31-mar-13 | 01-apr-13 31-mar-14 | 01-apr-14 31-mar-15 | 01-apr-15 31-mar-16 | |
| Weaned sows | 692 | 2,656 | 3,626 | 3,823 | 3,960 | 4,114 |
| (as % of total) | 3.7% | 14.1% | 19.2% | 20.3% | 21.0% | 21.8% |
| Weaned sows without litter | 31 | 143 | 202 | 185 | 293 | 362 |
After an analysis of the data, we visit the farm. There are quite a few litters in the farrowing house, especially from young sows, with low viability, poor looking piglets also showing lack of milk intake.
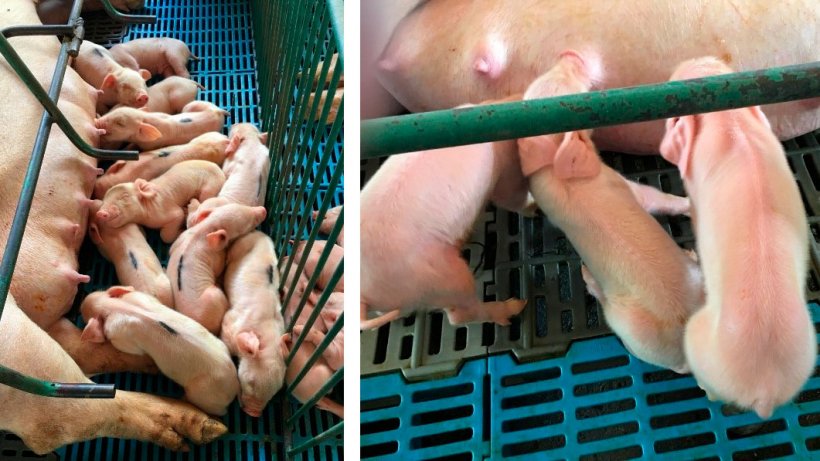
Photos 1 and 2. Left: litter with lack of milk intake. Right: Low-viability piglets with poor milk intake.
In addition, piglets are found with haemorrhages and necrosis.
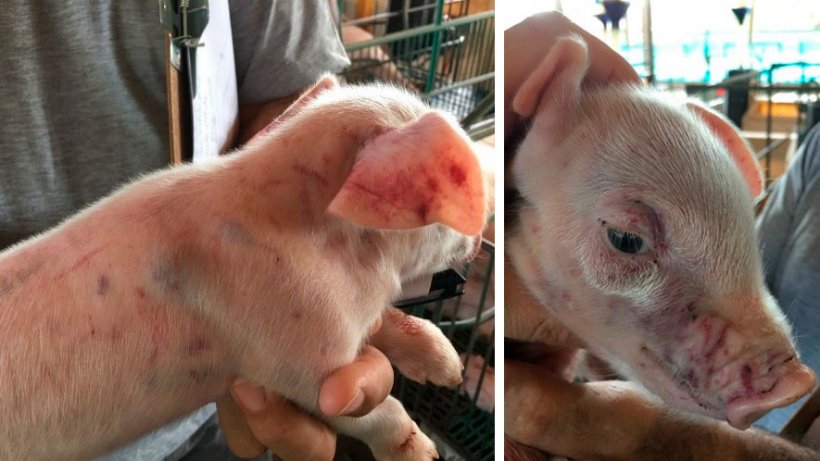
Haemorrhages are also seen in sows.
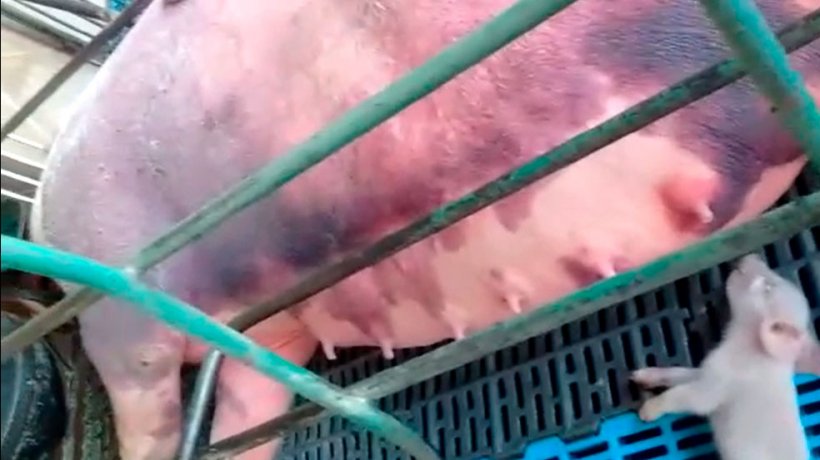
Photo 5. Haemorrhages in lactating sows.
Vulvar necrosis and vulvitis were also observed.

All these symptoms are compatible with a high mycotoxin presence in feed, in particular zearalenone and vomitoxin, and they explain the worsening of reproductive performance observed in recent months. The intensity of the symptoms will depend on exposure time and toxin concentration in the feed, although those clinical pictures offer no doubt about the source of the problem.
Conclusions and recommendations
The two problems described have different causes and, therefore, different solutions:
- Low prolificacy. Action must be taken in two areas:
- If possible, increasing the percentage of genetics A sows and reducing genetics B females. The difference between them is remarkable: approximately one extra piglet for genetics A.
- Increasing lactation length. A large increase is not necessary, since that would also affect other productive parameters of the farm. An increase of 2-3 days, which could translate into an increase of between 0.5 and 1 extra piglets per litter, would be enough. The supply of 30 extra farrowing pens would allow an extension of those 2.5 to 3 lactation days
- Mycotoxins The objective should be the reduction or elimination of mycotoxin levels in feed processing. For this, the use of raw materials with a high-suspected risk should be avoided and an effective mycotoxin binder should be routinely included. Apparently, a binder is already being incorporated, so it is recommended either to review its dosage or to rotate the product. It is also recommended to implement a routine quality control plan that includes a routine mycotoxin analysis of the raw materials used.
Finally, it should be noted that this case shows the convenience of combining farm visits with a thorough data analysis, for better detection of the causes of a specific problem and its possible solutions.