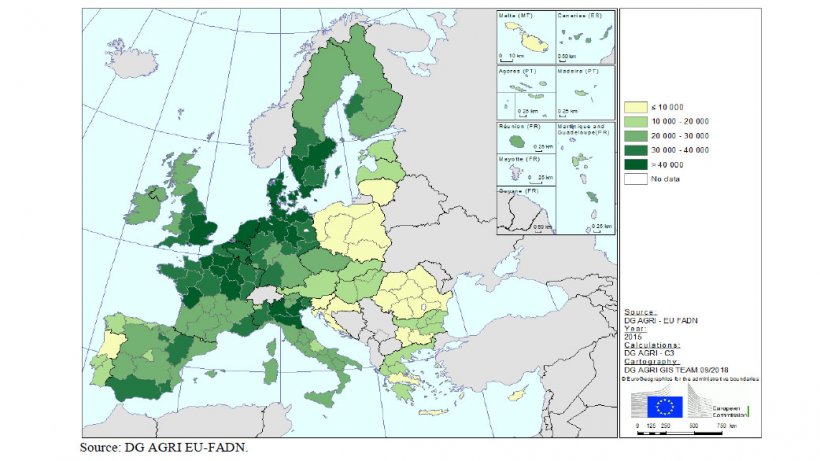
Particularly strong income growth was seen in the horticultural and wine sectors and for permanent crops (mainly fruit and berry trees, bushes, vines and olive trees). This trend was however not uniform, with the dairy sector showing declining incomes during these two years, principally as a result of global over-production leading to lower prices.
The latest figures highlight the wide variety of farm structures and systems within the EU and the considerable differences between sectors and Member States. Direct payments from the Common Agricultural Policy still represent a significant support to Europeans farmers, accounting on average for 30% of the farm value in the 28 EU countries in 2015, which demonstrates their value as vital income support to millions of farmers.

When measured by FNVA* per AWU, the general picture of income distribution by type of farming changes (see figure). Farms specialised in horticulture lose their position of having the highest FNVA in absolute terms, mainly due to the labour intensity associated with this type of farming. Farms specialising in pigs and poultry had the highest FNVA per AWU in 2015, and most of these farms are large in terms of economic size.

*Farm net value added (FNVA) is used to remunerate the fixed factors of production (labour, land and capital) whether they be external or family factors. In order to obtain a better measurement of the productivity of the agricultural workforce and to take into account the diversity of farms, FNVA is also calculated by annual work unit (AWU, work of one person occupied full time on a farm). This is one of the Farm Accountancy Data Network (FADN’s) main income indicators.
Friday October 19, 2018/ DG-Agri/ European Union.
https://ec.europa.eu/agriculture


